The 2015 Autostraddle Grown-Ups survey, open to LGBTQ women and non-binary folks over the age of 29, garnered over 4,000 responses and gave us a revelatory insight into the lives of our “grown-up” readers. Previously, we’ve used this data to talk about the first person you knew was gay and for our roundtable on What It Means To Be A Queer Adult. Now we’re gonna really dig into the numbers on how satisfied y’all are with your mental and physical health, social life, friendships, school, work and finances.
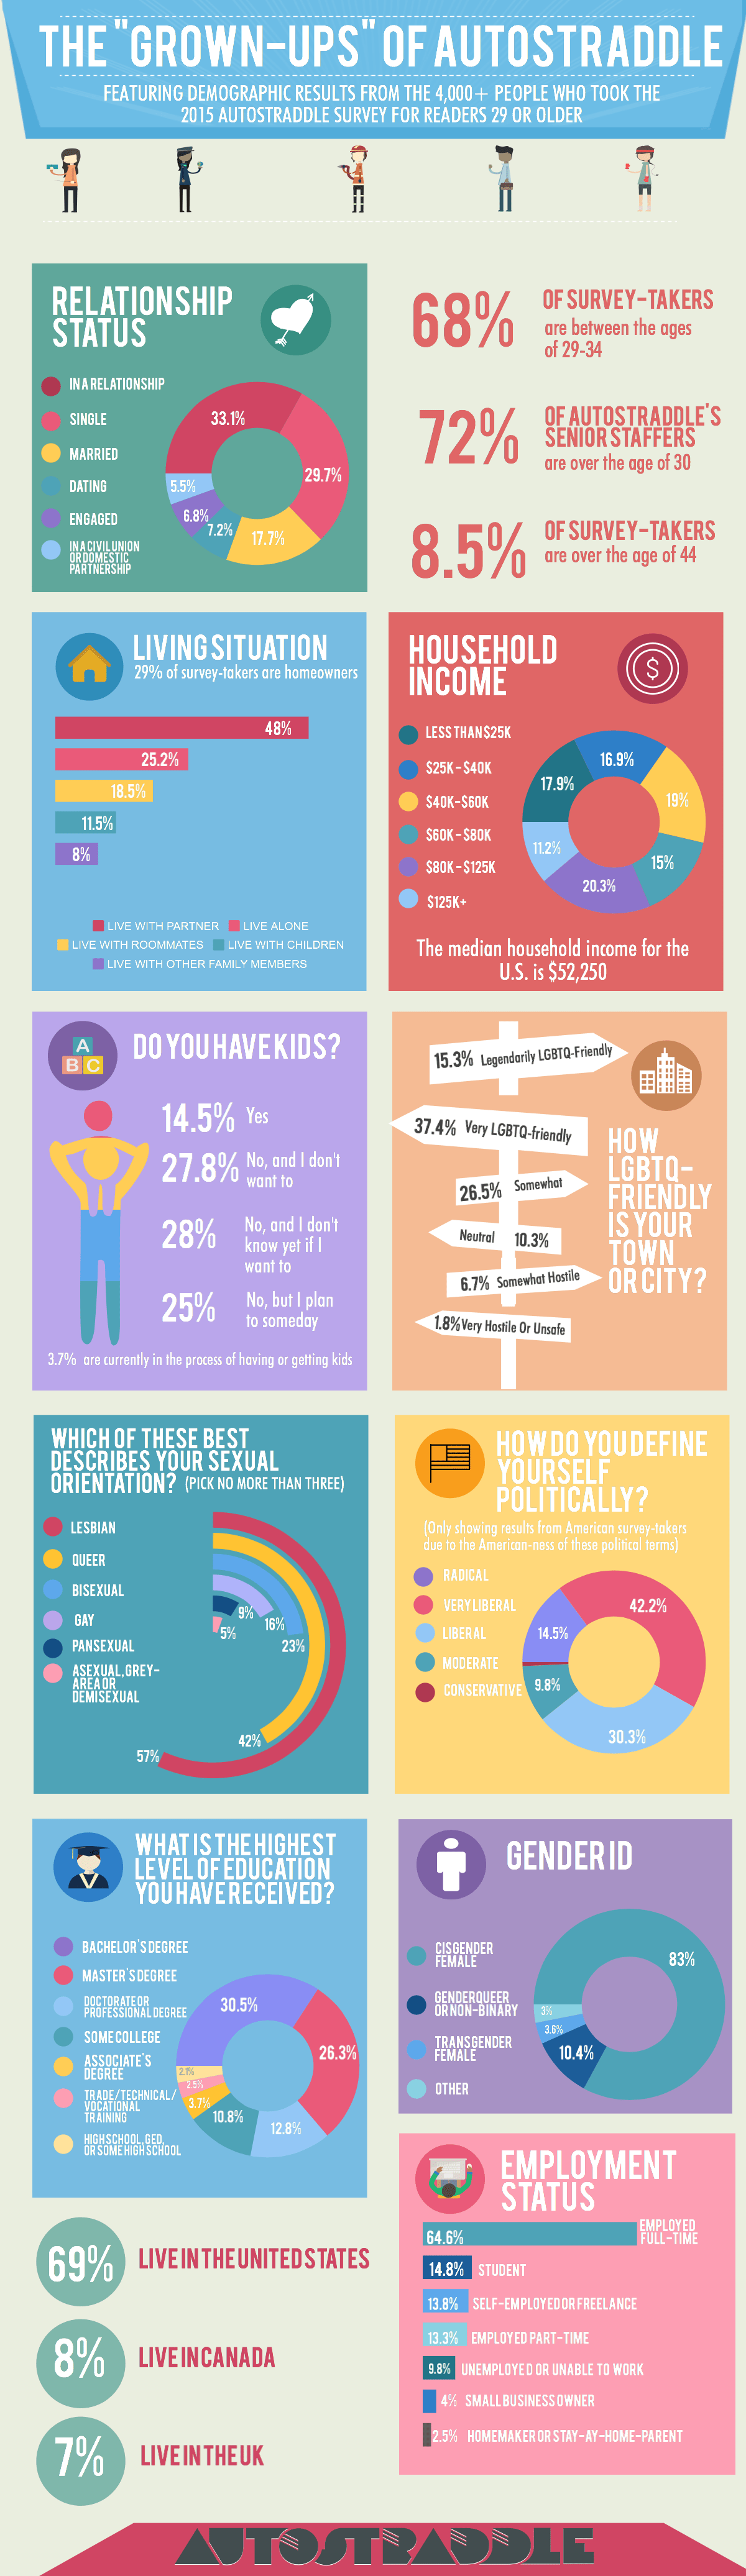
First, some demographics of the entire group:
One of the questions on the survey asked how satisfied you were with various aspects of your life: family, sex life, relationships & dating, finances, work, school, mental health, physical health, social life and friendships. Today we’re talking about LGBT women’s health — your satisfaction with your physical and mental health — and we’ll be talking about the rest of the things in the future!
Healthy Choice
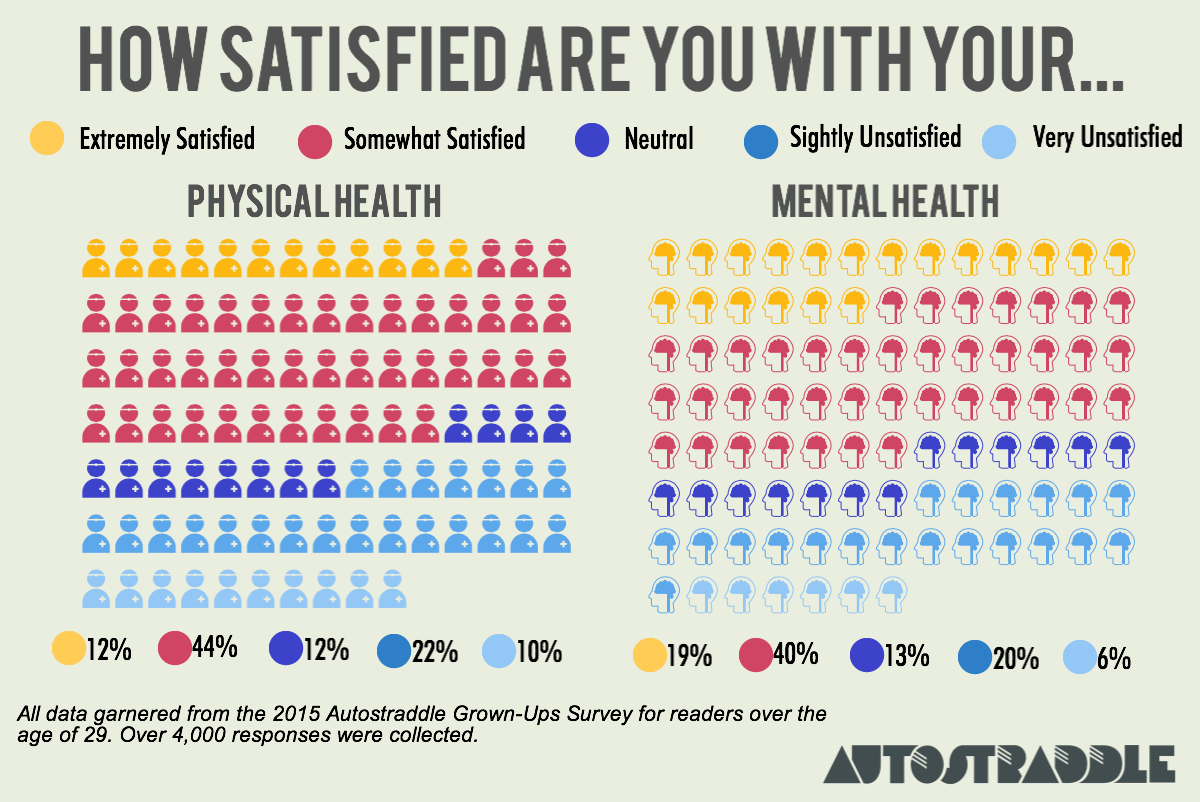
Below are the numbers on your level of satisfaction with your physical and mental health:
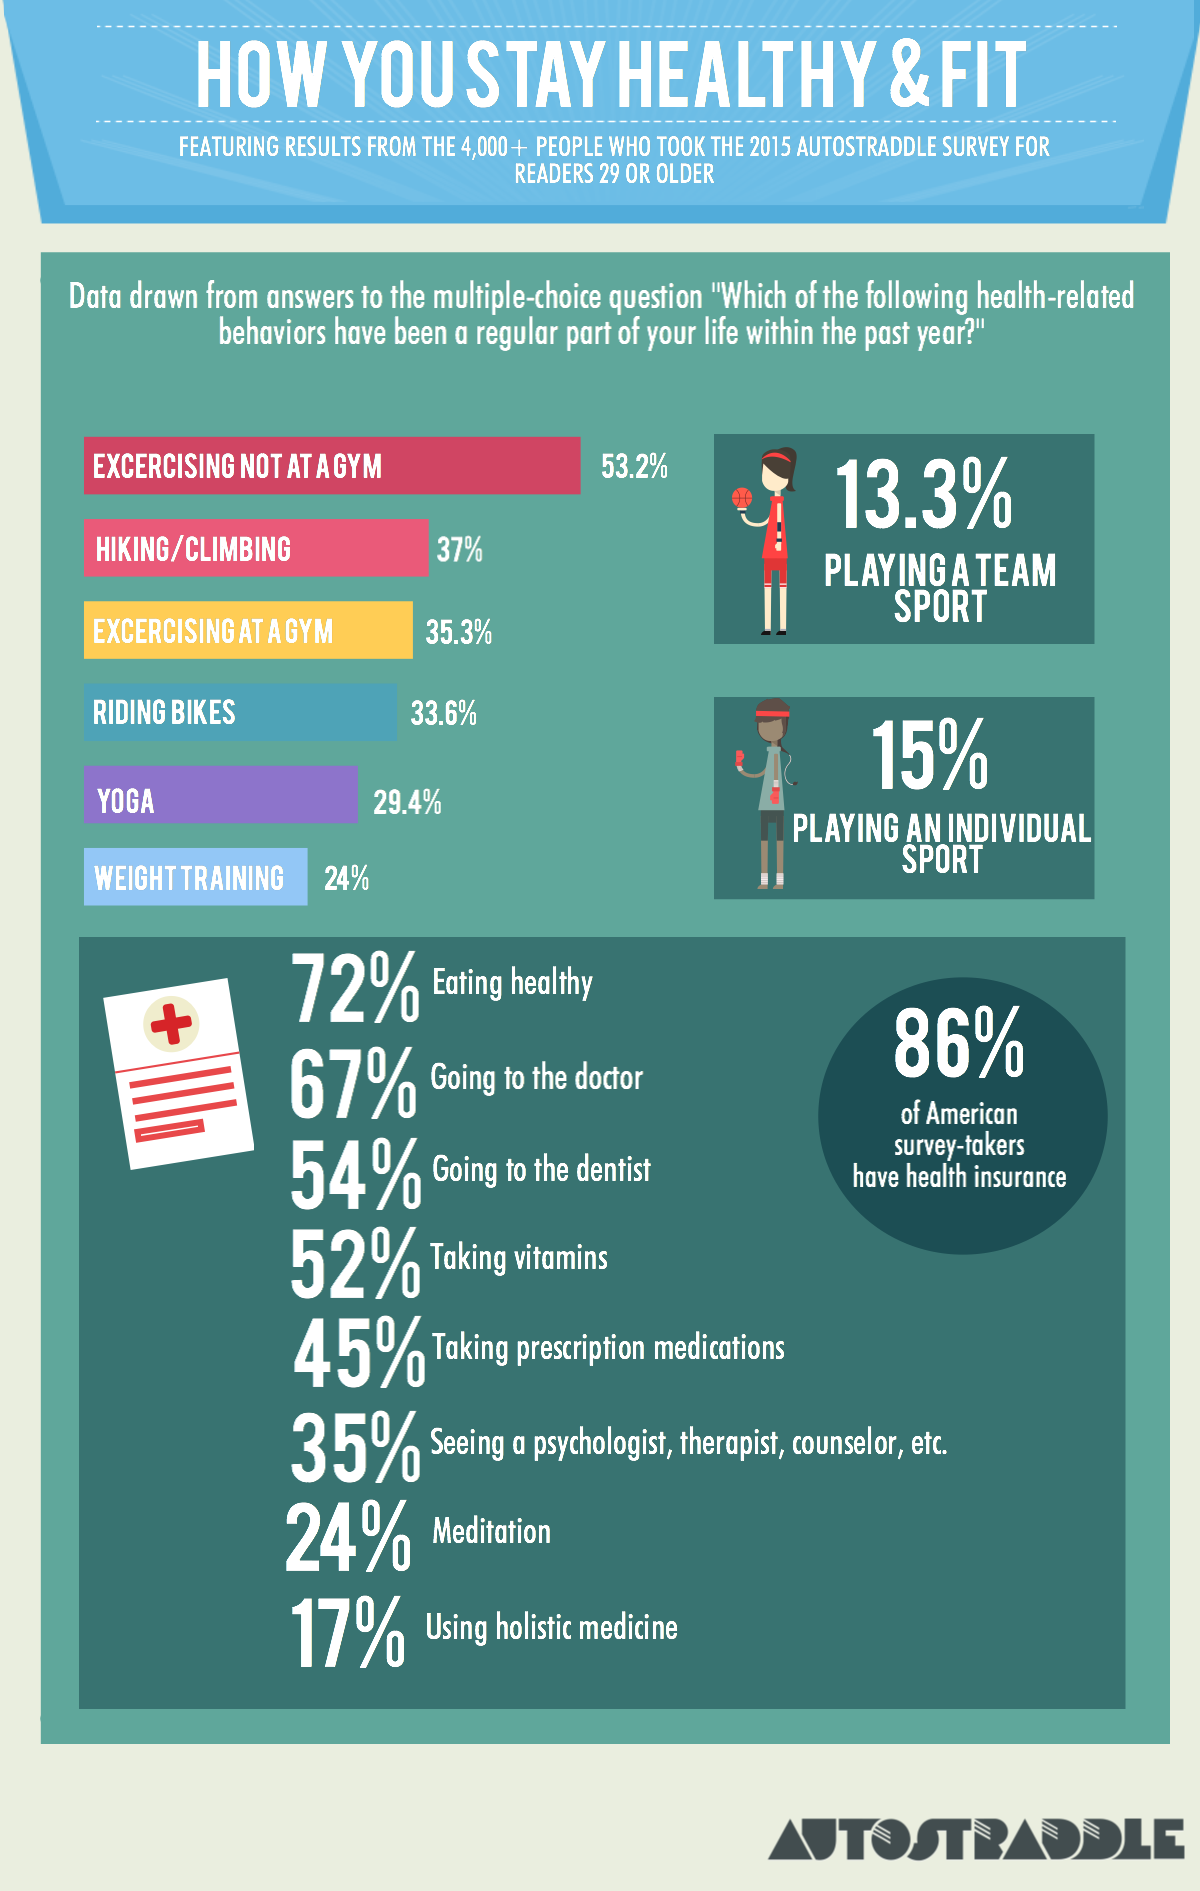
And here is the data on the health-related behaviors you’ve done regularly within the past year:
Survey-takers ranked their satisfaction on a scale of: Extremely Satisfied, Somewhat Satisfied, Neutral, Slightly Unsatisfied and Very Unsatisfied.
From here forward, when I refer to a group as “satisfied” rather than “extremely satisfied” or “somewhat satisfied,” I am referring to both extremely and somewhat satisfied people. Likewise, when I call a group “unsatisfied,” I’m referring to both slightly and very unsatisfied people.
Physical Health Overview
LGBTQ folks, women in particular, are statistically more likely to have poor physical and mental health than straight folks. From a 2014 Gallup report:
Physical well-being is another area in which there are stark differences between LGBT and non-LGBT Americans, particularly among women. One in three non-LGBT Americans are thriving physically, compared with about one in four LGBT Americans. This difference is entirely driven by LGBT women, as differences by LGBT status among men are not statistically significant.
So it was unsurprising that so many of you reported dissatisfaction with your physical health. Aside from finances, physical health was the area in which you were least likely to report extreme satisfaction — only 11.8% are. However, because 44.6% chose “somewhat satisfied,” the percentage of people who are either extremely or somewhat satisfied with their physical health — 56.4% — isn’t particularly deviant from results in other categories. We likely have very high standards for our own physical health.
Unsurprisingly, those who reported more satisfaction with their physical health were more likely to report participating in behaviors like exercising, playing sports, doing yoga, weight training and bike riding. For example, 47% of the extremely satisfied enjoy biking and 65% exercise outside of the gym, compared to 15% and 36%, respectively, of the very unsatisfied.
The extremely satisfied were also more likely to eat healthy (89% do, compared to 51.6% of the very unsatisfied) and much more likely to report having sex regularly (82% do, compared to 53% of the very unsatisfied).
Although whether or not you’d seen a doctor regularly in the last year had minimal impact on your physical health satisfaction, there does seem to be a correlation with going to the dentist — 64.7% of the extremely satisfied have done so this year, compared to 45% of the very unsatisfied. This is likely because those who can visit a dentist probably have robust health insurance plans or more financial resources, which tend to offer more avenues for the pursuit of physical health.
Another interesting finding is that whether or not you take prescription medication had a different correlation to your perception of your own health — 61.5% of the very unsatisfied take prescription meds, compared to 32% of the extremely satisfied. This could speak to the fact that needing medication for a condition, even if that medication fixes or helps manage said condition, is often enough to make us feel unwell, as is the incredibly relevant fact that we have a condition that needs to be medicated in the first place! I struggle with questions like this myself — is my health good because the medication I take manages my condition, or is my health bad because I need medication in the first place? And what impact do the side effects of psych meds have on my physical health?
When it comes to health insurance, LGBTQ Americans specifically have often lagged behind. A 2014 report from the Center for American Progress found that the Affordable Care Act had a significant impact on LGBT folks who make $44K or less — the uninsured rate went down from 34% in 2012 to 26% in 2014. On our survey, of Americans who reported household incomes of $40k or less ($44k was smack in the middle of the income brackets we used, so we can’t make an exact comparison), 22.3% were uninsured, which is consistent and even slightly more promising than the CAP’s data.
There are many areas of healthy behavior where we excel: 16% of Americans have gym memberships (and 90% never use them), but 37.5% of our American survey-takers regularly work out in a gym. 15.6% of Americans ride bikes regularly, but 32% of American survey-takers do. We’re a health-conscious bunch!
Mental Health Overview
Again we see the same correlation we saw with physical health, where those being treated for what ails them with therapy or medication are more likely to report unsatisfaction with their health in that area. Obviously those who are very happy with their mental health are less likely to feel they need counseling, so that makes sense. Taking prescription medication also plays a crucial role: 65% of the very unsatisfied take medication, compared to 33% of the extremely satisfied.
The satisfied are also more likely to report eating healthy and having sex regularly as well as participating in athletic activities, bike-riding, hiking, playing sports or exercising. Interestingly, however, one’s participation in yoga or meditation has no significant impact on one’s satisfaction with their mental health.
Another interesting finding: respondents who haven’t gotten drunk within the last year were less likely to report satisfying mental health — only 48% did, compared to 60.3% of those who’d imbibed more consistently. But it’s tough to say if that’s correlation or causation — non-drinkers could be alcoholics in recovery or unable to drink due to other health issues. Or, perhaps, there is some positive stress relief enabled by substances. Meanwhile, one’s drinking habits have minimal bearing on one’s physical health satisfaction.
965 people said they were very or somewhat unsatisfied with their mental health, and only 111 left comments on that section, but of those who did, a lot of you reported chronic health conditions, dealing with mental health challenges like OCD, PTSD and bipolar disorder, strained finances, divorce and living far away from friends or a community.
The Impact of Various Lifestyle and Demographic Situations on Your Physical and Mental Health
Those more satisfied with their mental health are far more likely to be employed full-time, although it’s difficult to parse out correlation/causation. 5.8% of the unsatisfied are unemployed because they’re unable to work, while less than 1% of the satisfied are.
Obviously having less financial resources means more day-to-day stress. 29% of the satisfied have a total household income under $40k, compared to 45% of the unsatisfied.
The link between income and health is stark, so I made a graph for you:

As you can see, the vector doesn’t just shoot straight up — there’s a dip. I suspect this may be because the dip bracket is composed of a lot of two-income households living on the cusp of “this isn’t enough” and “okay we can breathe.” Or it could just be that physical health isn’t as closely tied to income as mental health is.
Age
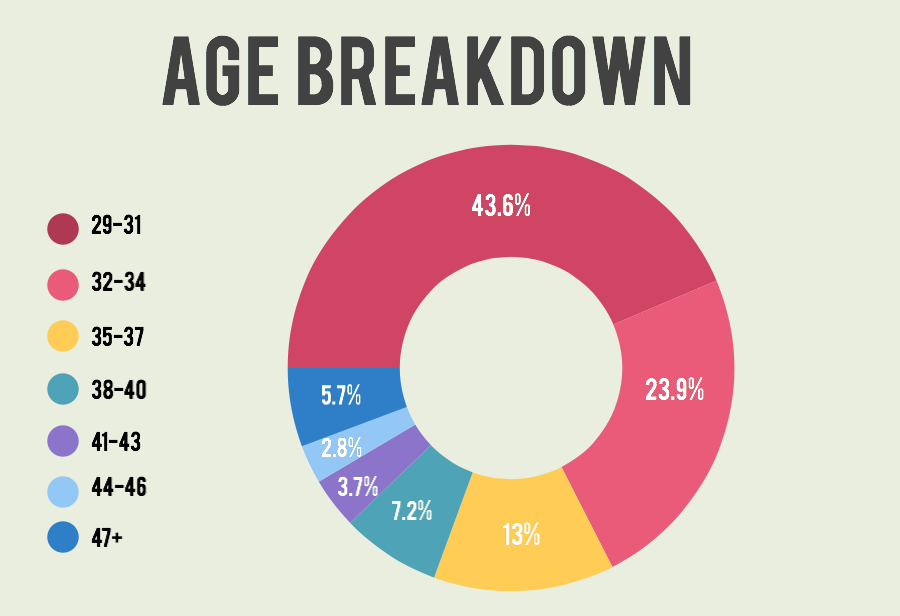
Here’s a surprising conclusion: there were very few statistically significant differences between age groups when it came to physical health satisfaction. Mental health, however, definitely seems to improve with age. Before we get into that, here’s how age broke down on our survey overall:
Among survey-takers between the ages of 29 and 34, 58% felt satisfied with their mental health. The Over-50s were the most satisfied, coming in with a 70.4%.
Sexual Orientation and Gender Identity
There’s a lot of research suggesting that bisexual women, specifically, are more likely to grapple with mental health problems. This does seem to be true for our survey-takers, but not dramatically so — 56% are satisfied with their mental health, compared to 60.2% of the whole group and 64% of lesbians. Only 15.4% are extremely satisfied with their mental health, compared to 19.7% of the whole group and 22.9% of lesbians. But one thing that happens when we look at a hierarchy of oppression is that we forget about the bigger picture — regardless of who comes out on top, the fact remains that there are heaps of lesbians and bisexuals struggling with their mental health.
Transgender women are also far more vulnerable to mental health issues, and that was relatively apparent on the survey, although we had a very small sample size of trans women (135). From that group, 44.4% are satisfied with their mental health, compared to 62% of cisgender women. 52.7% of genderqueer and non-binary folks reported satisfaction with their mental health, falling squarely in the middle. Trans women were less likely to report satisfaction with their physical health, too — 41.5% did, compared to 57.4% of cis women and 52.9% of genderqueer folks. It bears mentioning now and will come up as we get into more data that transgender women reported lower satisfaction levels for every life quality indicator on this survey.
Another dramatic difference between trans women and other survey-takers was prescription medication consumption — 84% of transgender women report having taken prescription medication regularly within the past year, which is much higher than the other groups, but is probably explained by hormone replacement therapy.
Geography and Being Out
Your social and geographical comfort with your sexual orientation and gender identity does have an impact on your mental health. Those who said their parents were cool with them being LGBTQ had higher mental health satisfaction levels (64.2%) than those who said their parents were not cool with it (50.8%).
We asked survey-takers if the city/town they lived in was LGBTQ friendly, allowing them to rank this factor on a scale of “legendarily LGBTQ-friendly” to “It’s unsafe to be out where I live.” 33.7% of those who ranked their home base as somewhat hostile, very hostile, or unsafe for LGBTQs reported dissatisfactory mental health, compared to 7.8% of those who lived in LGBTQ-friendly areas.
People who have children also reported more satisfactory mental health than the group as a whole. Those who live with a partner and/or with children did, too. Furthermore, those who live alone were slightly more satisfied with their mental health than those who live with roommates.
Relationship Status
This is where the numbers get really interesting.
The relationship status options on our survey were:
- Single
- Dating
- Engaged
- Married
- In A Monogamous Relationship
- In A Non-Monogamous Relationship
- In a Civil Union
- In a Domestic Partnership
The group with the highest healthy behavior levels were people who are “Dating” — 44% climb and hike, 42% go to the gym, 19% play team sports, 39% do yoga, 77% eat healthy. Single folks were the lowest.
Single folks were less likely to be satisfied with their physical health — only 46.5% are, compared to between 59%-62% for the groups in most other relationship situations.
People who are married, civil unioned or domestically partnered are the most likely to report excellent physical health, with 14.5% feeling “extremely satisfied” about their health. Those in monogamous relationships are closely behind, with 13.6% being extremely satisfied. Single folks bring up the rear with 7.7%. Mental health follows similar patterns: 46.1% of single folks are satisfied with it, compared to between 60%-70% for the other groups.
Researchers have found links between marriage and good health for heterosexuals. Ultimately, we’re animals who are more likely to take care of ourselves when we think somebody else is paying really close attention or relying on us in some way (although I believe strongly that a really awesome best friend can serve that same purpose). But other researchers have found links between singledom and good health for heterosexuals, showing singles work out more, have more friends, are more active in their communities, have less debt, and are less materialistic than people in married opposite-sex couples.
Our data, however, strongly favors the former result. Single people are the least likely to regularly exercise at a gym, ride bikes, play individual sports, go hiking or eat healthy. Satisfaction in other areas, like friendships and family, are also low for single people.
This suggests two things, of which one or both could be true:
1. There is something fundamentally different about same-sex relationships, like that maybe people of the same gender are more equipped to take care of each other’s health, support each other’s mental wellness or participate in fitness activities together.
2. There is something fundamentally different about being single and queer.
Why might this be the case, and is this a case of correlation or causation?
First let’s talk about Theory #1. Maybe two people of the same gender are more equipped to take care of each other’s health or participate in fitness activities together. This seems especially possible when you compare our readers in relationships with women (cis or trans) to those in relationships with cis men. (FYI, these numbers remain static even when reducing the “in a relationship with cis men” group to just bisexual and pansexual identified people, so these numbers are not a result of lesbians who are closeted and dating men.) The differences aren’t extreme, but they exist:
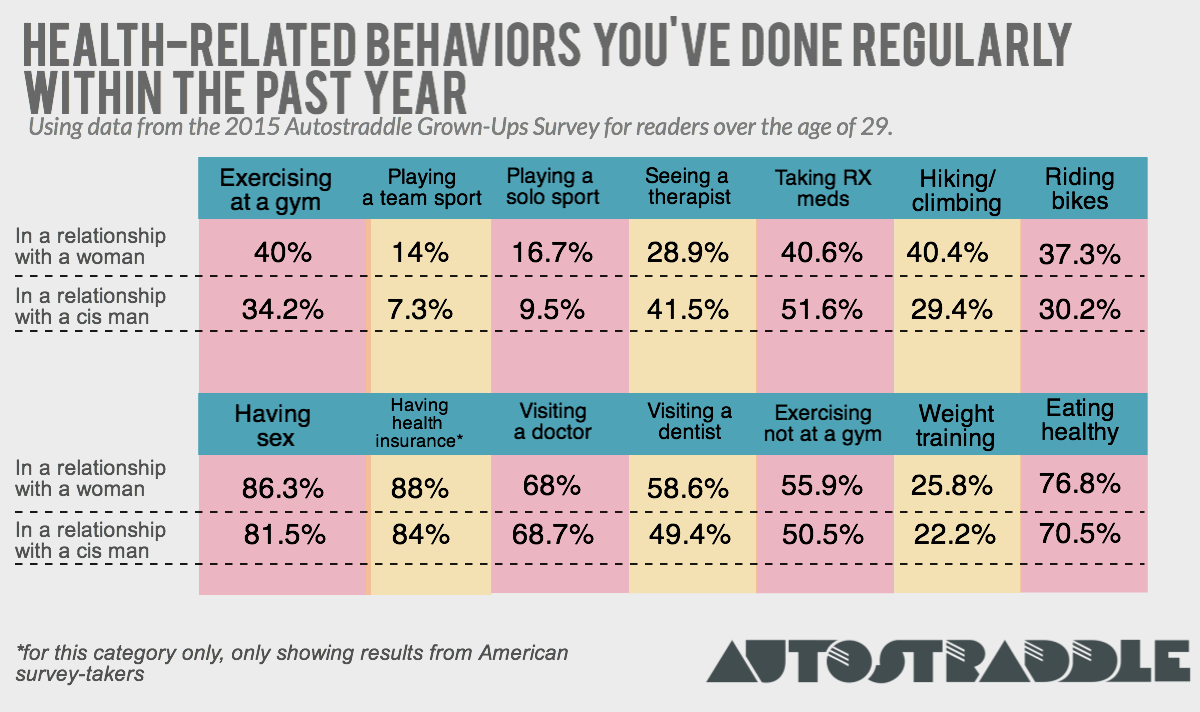
This goes against the common stereotype that women in same-sex relationships are more unhealthy and less sexually active than those in opposite-sex relationships. Of course this isn’t true across the board, but for a significant number of queer women, there does seem to be a same-sex relationship advantage. But honestly the numbers aren’t dramatic enough that I’d put money on it.
But relationships are, indeed, an immense sense of emotional comfort.
Now let’s talk about Theory #2. The bottom line is that it’s difficult to find a partner when we’re such a small slice of the population to begin with, and especially when we reach adulthood, social opportunities can feel few and far between.
A lot of the single folks on this survey had a lot going on, judging by answers on other questions and a lot of the comments left on open-ended questions. Many are unemployed and looking for work (over 7.6%, compared to 5% of folks in monogamous relationships and 3.8% of married people), dealing with chronic illness, recent breakups, recent moves and financial woes. Navigating these issues on your own can be tough, especially if most of your friends are wifed up. For queers, all these factors — money, health, relationships, friendships — seem inexorably linked, bleeding all over and into each other. Also, a disproportionate number of single queers who took this survey live in areas that are unfriendly to LGBTQs, and many of you mentioned in the comments that you can’t find friends or partners where you live. We’ll talk more about that when we talk about relationships and dating, though.
Some health-related open-ended comments from single folks:
- My hormonal transition has gone utterly wrong these past 3.5 years. Dealing with it takes whatever remains of my energy. No life.
- The stress of maintaining my home – it’s difficult when you’re on your own. Looking for a life partner.
- Stupid getting older and paying for what you did when you were young.
- Keeping myself from having a relapse into a major depression has been a huge problem that I didn’t have in my 20s.
- Why do I need a week to recuperate from stuff? When did my Asthma get so bad? Now I need two days after a night out before I’m fine again?
- My health is very bad and I’ve lost hope about getting out of here and having a life of my own. I was way more hopeful for the future back then.
- I’m concerned about if mental health will ever really be okay
- Health and mental health mostly but were issues before just continued inattention and lack of resources makes for degrading condition.
- I’m more concerned about my mental health even though it’s better than in my twenties
- I think being able to be all the way out would probably bump at least half of these up to “somewhat satisfied,” at the very least.
But, here’s some good news: for single folks, having good relationships with your friends and family can entirely compensate for the mental health gap. 56% of single folks with satisfying friendships and 55.4% of single folks with satisfying family lives reported mental health satisfaction, compared to 23.6% of those unsatisfied with friendships and 27.4% of those unsatisfied with their family. Having close relationships, period, whether with friends or family or a romantic partner, can enable high mental health outcomes.
It’s the unfortunate human condition that so much of our happiness is tied to things we can only control to a limited degree: relationships, sex, money. These are elusive, slippery things! How do we fix it?

Fantastic graphics and great analyses! I look forward to seeing more of the results & analysis.
“whether or not you take prescription medication has the reverse impact on your perception of your own health–61.5% of the very unsatisfied take prescription meds, compared to 32% of the extremely satisfied.” — this struck me as very odd phrasing, for reasons which were then kind of addressed: I’m pretty sure I take prescriptions meds *because* of problems I perceive with my health, not the other way around. I guess my point is just that “impact” seems like a strange choice of words here?
I think the reality for a lot of people is that prescription meds don’t lead to “good health”, exactly; they hopefully lead to better/less-bad health. So I don’t think it’s surprising that people taking meds feel less healthy, and I don’t think it’s an indicator that taking meds is the reason we feel less healthy. Probably a lot of people in that situation feel less healthy because we *are* less healthy, with or without meds? I don’t think it’s like “oh I need meds for this, that must mean I’m unhealthy”, I think it’s like “I feel bad, that means I’m unhealthy”.
I’m looking forward to reading the rest of this article.
I agree that “impact” is probably not the best choice of wording. The study shows a correlation between the behavior (taking meds) and how people feel about their health, but I think the word “impact” implies causation or an effect, that taking the meds caused/influenced them to feel this way. While that maybe be the case, I don’t think this survey measured that.
yes, this is totally valid. i will think of a different word and edit accordingly!
Interesting stuff. Thanks for taking a look at us!
Wow, excellent analysis and visual displays of quantitative information! Thanks for your work in collecting and presenting these data, Riese.
Great work so far! It seems like there’s a lot going on here, and that there’s quite a bit more analysis coming. I’m interested to hear more about Autostraddle’s adult trans community, even if the sample size is pretty small. Particularly, I’m curious about what correlations there are with health, outness, finances, and insurance coverage.
It was also pretty sobering to look at the health/income graphs, even if the results aren’t that surprising. Likewise with the “Geography And Being Out” section – there’s a reason why I want to move someplace with any queer/trans community!
I have never ever seen survey results that felt so relevant to me/my life. Thanks, team.
I am REALLY confused by your choices of options for relationships. To compare your readers’ — who you regularly acknowledge may be trans or nonbinary, like, on this link — relationship with all women to cis men only is…missing a huge section of the population.
Not all your readers are women. Not all your readers who ARE women are dating people on that chart. Where do trans men fall in here? They’re not women. What if you’re dating a nonbinary person and/or are nonbinary people dating each other? Is there a difference between dating (any woman-identified person) and (any male-identified person), or does it have to do with identification as cis, or, or? You’ve just eliminated some variables completely so you have no idea. (I’d chalk it up to a weird take on biology, but sex is not binary, either.)
Look, I realize that this started out a primarily lesbian/women-centric blog, but it’s been REALLY GOOD about trans guys, trans women, nonbinary folk etc and that’s why I’m so completely baffled by the relationships represented by this survey. Similarly to how I feel when the queer community are the ones with the most biphobia, I feel like the carpet’s been pulled out from under me on this one, because I expect these sorts of ignorant erasures from mainstream news, but not on AS.
I just can’t see a reason why this minimalistic and frankly bizarre data gathering was necessary.
Did you take the survey? The options you mentioned were all included for survey takers.
For the purpose of that particular section of analysis, I included trans women with “women” because trans women are women. Lesbian trans women are lesbians. It’s not mutually exclusive, as you imply. And there weren’t enough trans women and partners of trans women answering the survey to make statistically significant results by separating that group out of women as a whole – but there were enough to group and answers were similar. The other situations you mention (women or non binary people or trans men dating non-binary people or trans men, combinations therein) wasn’t an option enough survey takers indicated to produce statistically significant results, either. And grouping a handful of trans men in with cis men would be a disingenuous way to analyze that group. So that wasn’t part of that analysis. But in this case, it was part of how the data was collected. Because those are small and under-researched groups, the last thing I wanna do is draw conclusions from only a small sample.
Regardless though, being inclusive of everybody’s identity and collecting solid relevant useable data are often at odds with each other. Sometimes we will just research women-identified people and though that’s not what we did here, I’m not on board with the concept that lgbtq women are unworthy of study on their own, either. Specific demographic groups are often studied by researchers, and applying standards of inclusivity in communities to research and data collection isn’t really fair.
“I included trans women with “women” because trans women are women. Lesbian trans women are lesbians.”
This so much. This is what trans women inclusive spaces do. This is acceptance not tolerance. Tolerance is the bare minimum and can still be othering and non-accepting. I feel like an “other” in some lesbian spaces or nervous to venture into the comments in some lesbian spaces but never here. Here I’m just another lesbian. Thank you.
If only it were possible to gather information about energy levels…
Amazing stuff, thanks for all your hard work!
Fascinating data, great analysis. Thank you!
This is amazing! Well done for putting together such a brilliant survey and crunching the results like this. I think it’s such a great way for AS to use its platform and gather data like this, which has so many uses. The first of which is, it makes amazing content! I really loved reading this.
Is there any specific reason why there’s no stats on race although there’s stats on so many things? Many surveys have shown that people of colour report worse health outcomes, I think it would’ve been a relevant variable to look at.
yes, there is! the software can only cross-analyze individual demographic groups if those groups have identified themselves via pre-determined answers as a multiple choice question. race was an open-ended question (because in the past, we’ve tried the standard multiple choice options used by most researchers and also tried the same multiple choice but with the option to pick more than one, and still over half of respondents picked “other,” even if the option they write in was one they could’ve checked off, and “other” responses can’t be filtered/compared), and there’s no way to separate people into groups via write-in responses. i think in general people who take our surveys as opposed to other scientific studies see our surveys as extensions of the site rather than as a scientific study, and so they tend to want to identify themselves precisely and be seen in their entirety and don’t respond well when being asked to put themselves into only one box when that box isn’t totally accurate.
i can tell surveymonkey to only show me the answers of people who checked off “lesbian,” but i can’t tell surveymonkey to only show me the answers of people who wrote a certain word as a certain answer to a certain open-ended question or in an “other” box — and even if i could, people use such a vast array of words to describe their race that it would be impossible to determine the golden word for categorization. even grouping them manually is tough because unlike many other demographic categories, there are infinite possibilities for racial identification, and grouping together all mixed-race people as one in the same feels really inaccurate. we asked anyhow in case at any point in the future somebody has time to manually organize all the surveys into groups and manually calculate subsequent data.
i think in the future we’re going to try asking people if they identify as a person of color or not, to at least get some kind of categorization going that can be analyzed usefully. although again, that can be really subjective (especially with an international group).
I didn’t realize you guys use surveymonkey for your data processing. To get something as simple as a % breakdown of the races of people who responded to the survey would only take a couple of hours max and can even be done in Excel so without any specific (& costly) statistics software. You’d just have to assign numbers to specific worded answers e.g. “White” = 10 then with “Find and replace” convert the answers into numbers. Then with a simple frequency function Excel will generate the stats for you. You wouldn’t need to lump all mixed race individuals in one category because you can create as many numerical categories as you want. It’s not like people don’t also have very different and diverse ways of defining their gender identity and sexuality as well but somehow it’s possible to generate data on those.
I am such a nerd and I am loving every single thing about data that you post. Really looking forward to reading more from this survey!!! So amazing to actually see data about us.
Thank you! It’s really fascinating to gather and talk about too!
This is fascinating. Thanks.
I appreciate all the work that’s put into the reader surveys. This is all extremely interesting! Everything you decided to pull for analysis was really revealing.
now I am sorry for forgetting to take the survey. this is really interesting
I love these surveys. You do such a great job of collecting so much information and analyzing it.
I love this! Data and queers are two of my favorite things!
The relationship-status bit is especially relevant to me. I’m recently single and actually exercising more now (it gets me out of the house and around other people) but eating healthy food/complete meals has gotten harder. Something about cooking for just me…motivation is hard.
So, the CDC itself has talked about mental health and sexuality with the 2010 Intimate Partner Violence survey, which takes an entire year to complete and an extra one to two in order to analyze. It’s quite a big survey.
The 2010 findings were really sad. 1/5th of lesbian women (20%) and 1/5th heterosexual women (22%) reported concern for their safety in their relationship and/or reported symptoms of PTSD.
However, bisexual women reported one-half (48%).
I totally realize the Autostraddle survey was more health-oriented, but stay with me here. With regard to being raped at least once in their lifetime, 1/8th of lesbian women (13%) and 1/6th of heterosexual women (17%) reported it to the survey.
Again, bisexual women reported approximately one-half (46%).
If you want to learn more, it’s easy to find: “2010 Findings on Victimization by Sexual Orientation” plus “NISVS Special Report Page” should get you to it pretty quickly.
So, with that in mind…
On what planet did you find it acceptable to handwave the disparities in mental health satisfaction between self-identified lesbians and bisexual women in this survey?
I realize that none of your data is weighted, that a roughly 8% difference seems small to someone who isn’t a statistician, and that your data set is very limited. SurveyMonkey probably doesn’t even have an option to calculate statistical significance. However, instead of keeping these things in mind, you found it appropriate to implore that we look at the “bigger” picture and to lump mentally ill lesbians and bisexual women together because bisexuals, apparently, do not require attention, or at least no attention past what lesbian women specifically receive.
Though, I agree: the bigger picture is important.
The bigger picture is 1 out of 5 versus 1 out of 2. That was the safety concern and PTSD symptom question, mind — very inextricably linked to mental health. Rape, too, is inextricably linked, and that disparity is even more laughable.
I don’t think you “meant it like that,” and I’m not here to start a distasteful internet fight. I would never, ever dismiss 1 out of 5 nor 1 out of 8 — 1 out of 1 BILLION is unacceptable. I think EVERYONE deserves respect, health, and happiness. That’s why I’m here with hard facts from the CDC, and it’s why I’m trying my best to point out how horrific and violent it is to dismiss the difference in experience (both in violence and mental health) between bisexual women and lesbians in this article.
Considering that correlation and causation were seriously confused with regard to taking medication and being unsatisfied with one’s health, I’m hoping that this error, too, will be amended.
As a bisexual CSA and incest survivor who unfortunately was assaulted by a woman partner later in life, too, this was a very triggering oversight to witness and need to point out. I really wish it hadn’t happened.