

As we head into the 2020 election, our contributing data brain, Himani Gupta, is analyzing data from past Autostraddle surveys to find out what issues are most important to our community and what is currently at stake.
In this week’s Senate confirmation hearings, Amy Coney Barrett’s reticence to talk about her positions made it pretty clear how much damage she plans to do once she gets to the Supreme Court. Among the many disturbing things we know about Barrett’s political views, her stances on several health care issues are going to inflict a lot of harm on a lot of people.
Autostraddle’s Politics Survey, launched in December 2019, asked about a number of topics related to health care, namely: religious freedoms, reproductive rights and the affordability of care. At the end of July, I followed up with some of the original survey respondents to see if anything changed in terms of how they thought about the affordability issues in the wake of the pandemic.
We’re going to look at just how important these issues are to our community and discuss what’s at stake with Barrett’s impending nomination to the Supreme Court.
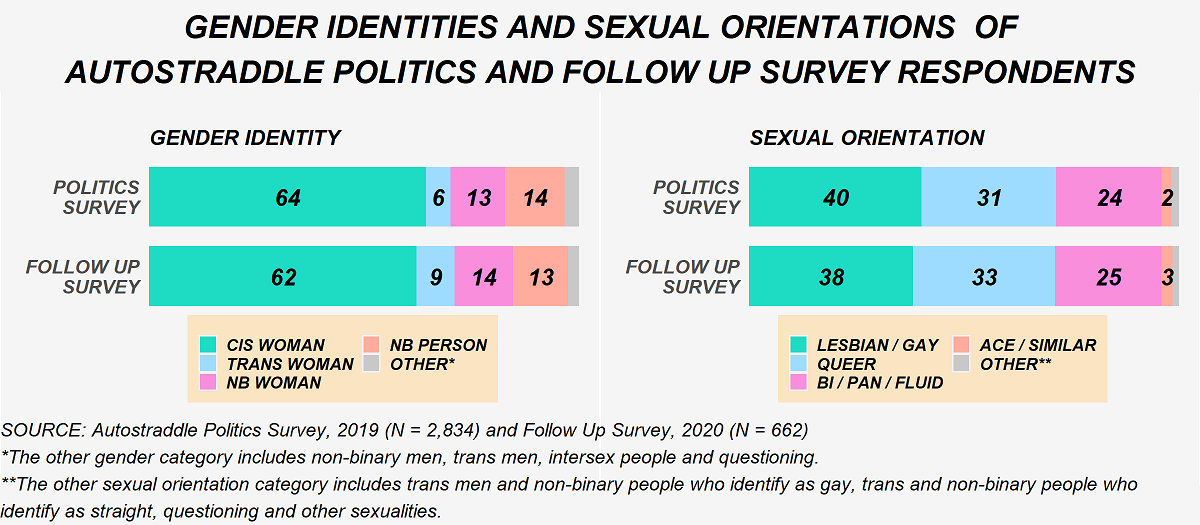
Who Took the Politics Survey
Before we turn to those results, we need to start by understanding who took the Politics Survey and who participated in the follow up.
The Politics Survey was available for anyone to take on Autostraddle’s website between December 3, 2019 and January 10, 2020. Over 4,400 people started the survey and just over two thirds made it to the mandatory questions on gender identity and sexual orientation. The analysis is restricted to queer people who identified as women, non-binary and/or trans, which gives us our sample of 2,834 respondents.
At the end of July, I reached out to the 994 Politics Survey respondents who said they were open to being contacted for follow up. Between July 26 and August 16, 662 people completed the Follow Up Survey. This divides our original sample into two subsamples: people who took the Follow Up Survey and people who didn’t.
For the most part, the Follow Up Survey respondents are a similarly diverse group of people compared to those who didn’t take the Follow Up Survey. A slightly greater proportion of trans women and non-binary women took the Follow Up Survey. The gender identities and sexual orientations of respondents to both surveys are shown below.
While the two subsamples are similar in terms of race/ethnicity, disability status and age, they differ on education. As shown in the figure below, more of the Follow Up Survey respondents earned a bachelor’s degree as their highest degree.
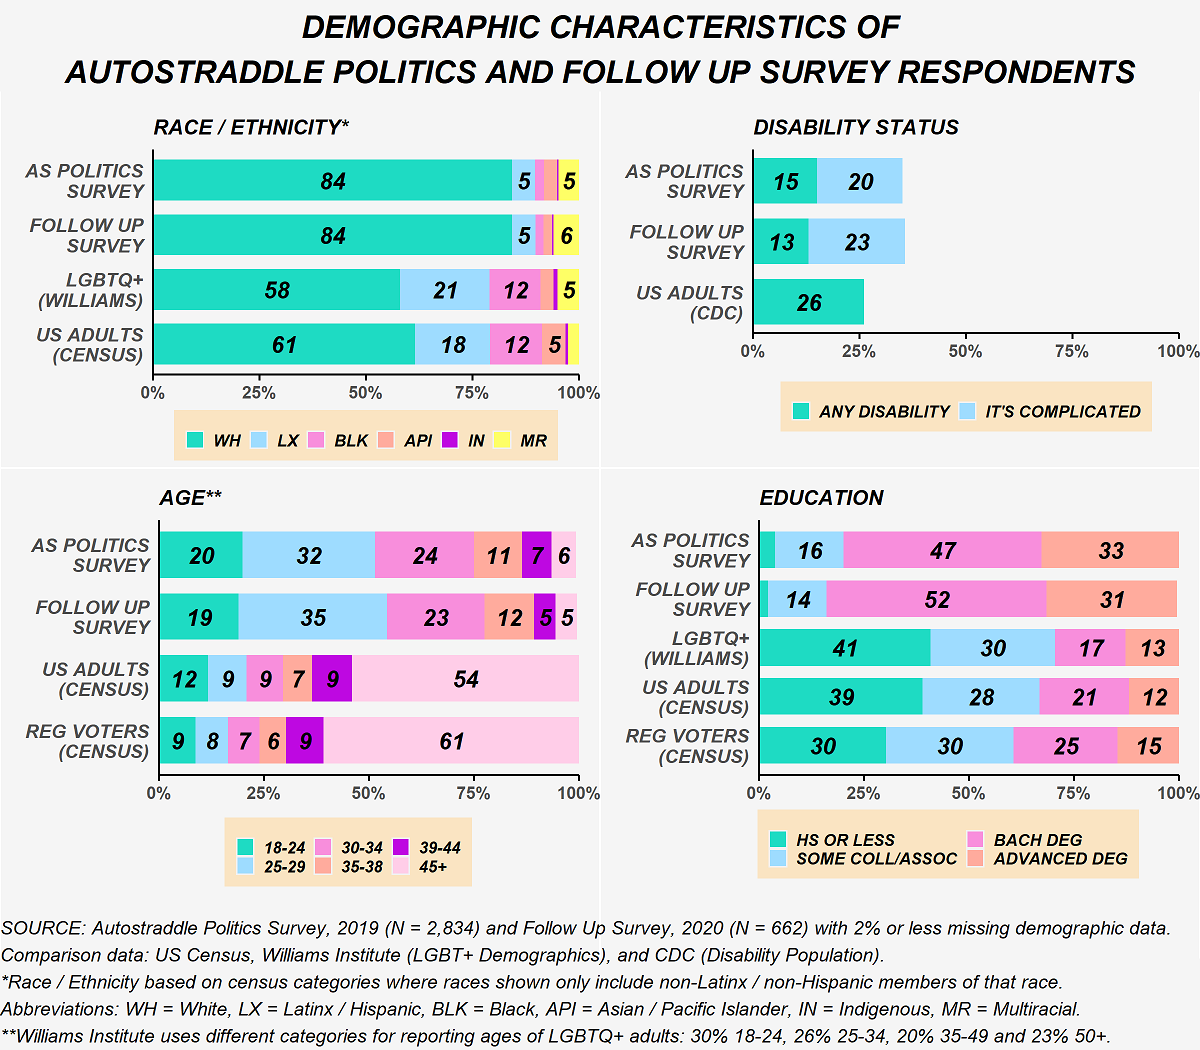
Another key difference is that fewer people living outside the U.S. participated in the Follow Up Survey. As a result, more of the Follow Up Survey respondents are registered to vote in the U.S. Once we account for this difference, the two subsamples are similar in terms of what region they live in. They also live in similar types of places, generally. (Note that the U.S. Census uses “urbanized clusters” and “urbanized areas” in its data collection, which are very different from how most people think about urban and suburban.) In terms of income, there is some variation, even after accounting for the differences in the proportions of non-U.S. residents.
There are, of course, unmeasurable differences between the type of person who would complete a second political survey and the type of person who wouldn’t. That being said, the Follow Up Survey provides important insight into shifts within our community.
“Anyone Who Would Discriminate ‘Based on Their Religious Beliefs’ Should Not be in Health Care.”
Far too often religion becomes the justification for mistreatment in health care, particularly when it comes to LGBTQ+ friendly and, especially, trans-inclusive care and reproductive rights. Based on a poll conducted by The Economist/YouGov in October 2019, Americans are conflicted in their views on a government regulation allowing medical providers to deny services because of their religious beliefs. Those divisions are largely along partisan lines with 81% of liberals opposing such a measure compared to 55% of conservatives supporting it.
Autostraddle Politics Survey respondents were in resounding opposition. Going beyond that question, several people further emphasized in free text comments that providers who have religious qualms about providing services should not be working in health care.
The figure below compares the results from the Politics Survey to the Economist/YouGov poll.
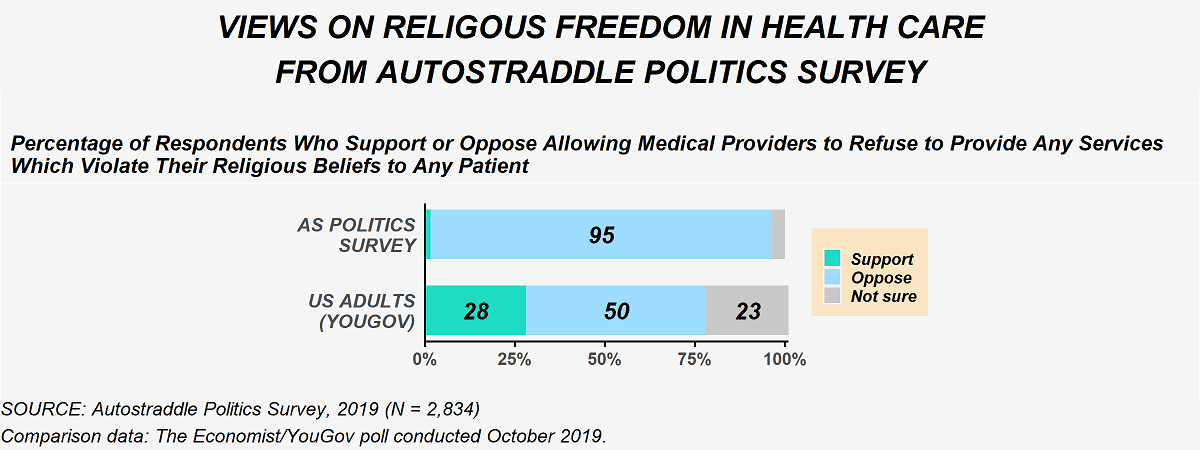
While the topic of religious freedoms in health care specifically didn’t come up in the confirmation hearings, Barrett’s views on religious freedom more broadly are well established. Earlier this week, writers for the Washington Post laid out Barrett’s disturbing history of supporting “preferential treatment” for religious expression. It’s likely, based on her record, that if a case on religious freedoms in health care were to make its way to the Supreme Court, she would rule in favor of those who are denying health care.
It’s also very possible that a case on this exact issue will make its way to the Supreme Court soon. In May 2019, the Trump administration created “conscience” protections that would prevent health care institutions from accessing federal funds if they took disciplinary actions against health care workers who denied services because of their religious beliefs. A few months later, in November of that year, a federal judge struck down the rule.
Anti-Trans Discrimination In Health Care Was Already A Big Problem. And Then the Trump Administration Intervened.
The Politics Survey asked respondents if they had been denied health care because of their gender identity or presentation. Among the overall sample, 5% of respondents said they had been denied services and 8% said they were unsure if that had happened to them.
But those overall numbers mask a deeper story. The figure below shows the stark differences in responses to the question on denial of services by the gender identity of the survey respondent. 50% of our trans women respondents had either been denied services because of their gender identity or presentation or had an ambiguous experience along those lines. About a third of our non-binary respondents shared that experience as well.
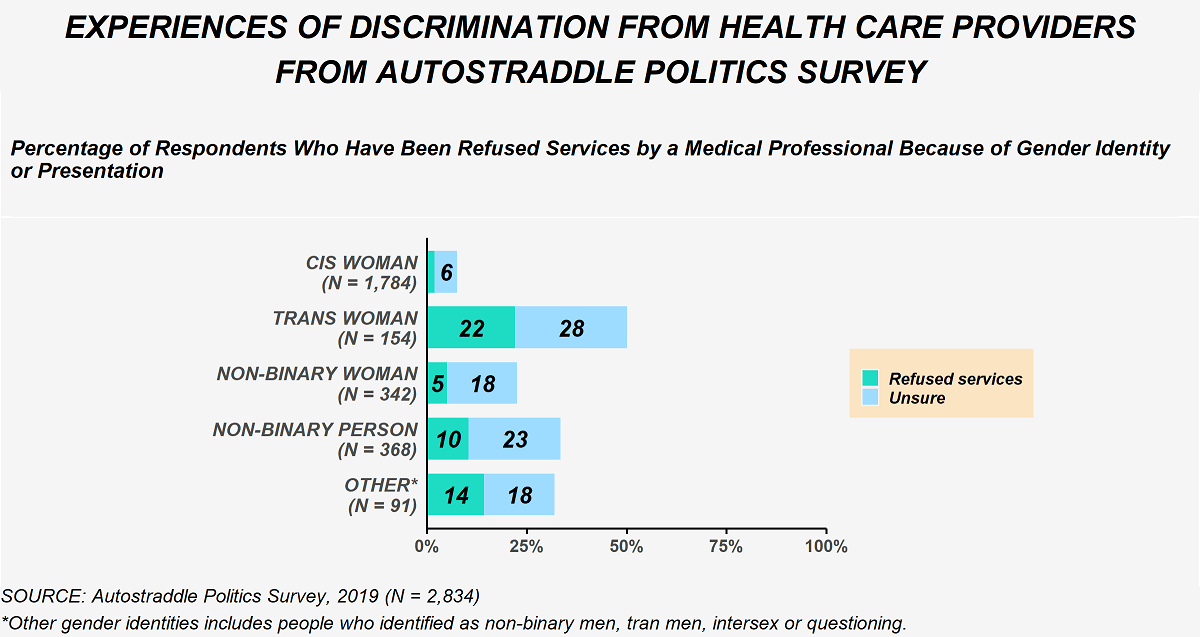
In addition to the responses shown above, several people shared other negative experiences in free-text comments, such as being discriminated against in other ways, traumatized and mistreated by trans-incompetent health care providers. Others mentioned putting off health care to avoid mistreatment and discrimination.
In an effort to address some of these issues, in 2016 the Obama administration implemented anti-discrimination protections on the basis of gender identity. In June of this year the Trump administration eliminated those protections. Mere days later, the Supreme Court issued its landmark ruling in Bostock v. Clayton County. In the majority opinion, Justice Neil Gorsuch wrote that discrimination against trans people qualifies as “discrimination on the basis of sex.” Although that case was dealing with employment protections in the Civil Rights Act specifically, the same logic applies to a whole swathe of other legislation, including the Affordable Care Act. In fact, in August, a federal judge struck down the Trump administration’s attempt to end trans health care protections, citing the Bostock decision.
It seems almost inevitable that trans health care protections will find themselves before the Supreme Court sooner or later. And while Barrett’s views on the rights of trans people did not come up in the confirmation hearings, her use of the term “sexual preference” when asked about LGBTQ+ protections speaks volumes about how she views the community as a whole. Though she later apologized for using the term, her ties to a law firm that has fought to legalize discrimination against LGBTQ+ people have also been reported this week.
Reproductive Rights Have Been Steadily Eroded for Decades.
Even before Barrett was nominated, the alarms were sounding that Roe v. Wade would be effectively gutted by a Supreme Court with a conservative-majority. In many ways, it already has been. Abortion is such a hot button issue that any law that gets passed, whether at the state or even a long-shot attempt in Congress, inevitably will make its way to the courts and, often, up to the Supreme Court. That small handful of people wields an incredible amount of power when it comes to reproductive rights.
Barrett’s views on abortion are clear. She has a long history of explicitly opposing the right to choose. Yet, when directly confronted on the issue during the Senate confirmation hearings, she, unsurprisingly, punted, claiming she would not be going in with an “agenda.” I’m not sure how someone who sponsored a “right to life” ad in 2006 can claim to not have an agenda on this topic.
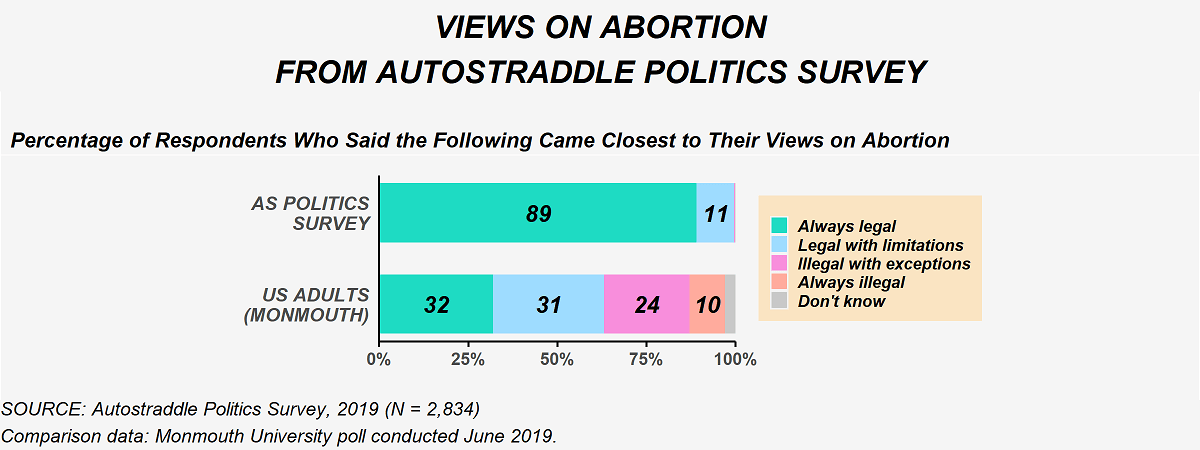
Respondents to Autostraddle’s Politics Survey could not be farther from Barrett in their views. There was near unanimous support for abortion with almost 90% supporting that basic right to choose in all circumstances and another 10% wanting it to be “legal with limitations.” That was, more or less, consistent no matter how I sliced the data. In contrast, a Monmouth University poll from June 2019 found that while nearly two-thirds of American adults want abortion to be legal in some capacity, only 29% fully support it in all circumstances. The figure below compares these results.
The High Cost Of Health Care Hits Our Community Particularly Hard.
Alongside these battles over what medically-necessary services are legally permissible is the fight over the prohibitively high cost of health care. A well-established problem nationally, this is another aspect of the health care system that especially harms our community. The Politics Survey asked whether respondents to indicate whether they or someone in their household had forgone needed services because of they could not afford them. Results from the Politics Survey are compared to a Monmouth poll conducted May 2019 in the figure below. Note that all results discussed in this section exclude Politics Survey respondents who live outside the U.S. because of the policy-specific nature of this issue.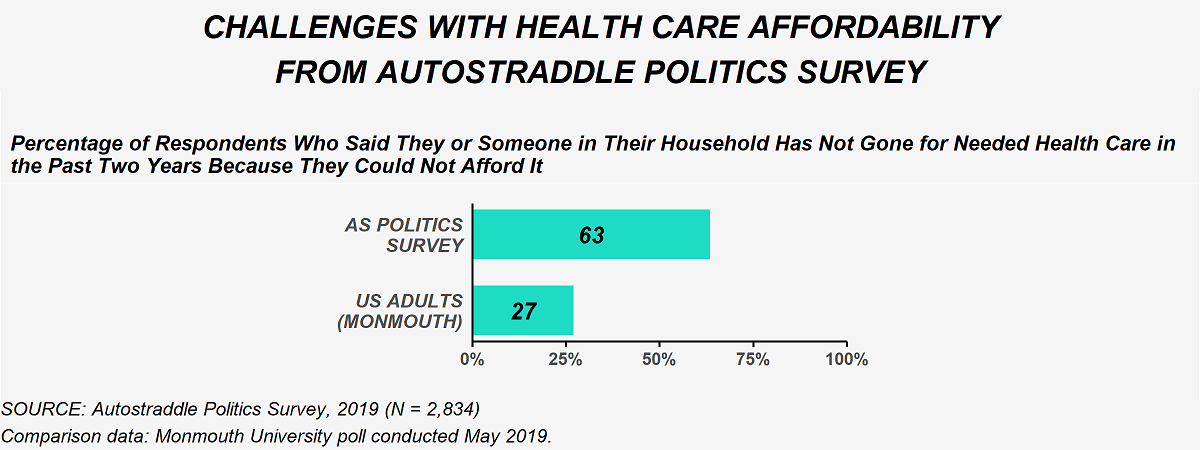
Once again, the overall numbers hide a deeper story. The Monmouth University poll found substantial differences in the response to this question by income, which is unsurprising given that cost is the underlying issue. A similar pattern was observed among Politics Survey respondents, as well. This comparison is shown in the graphic below.
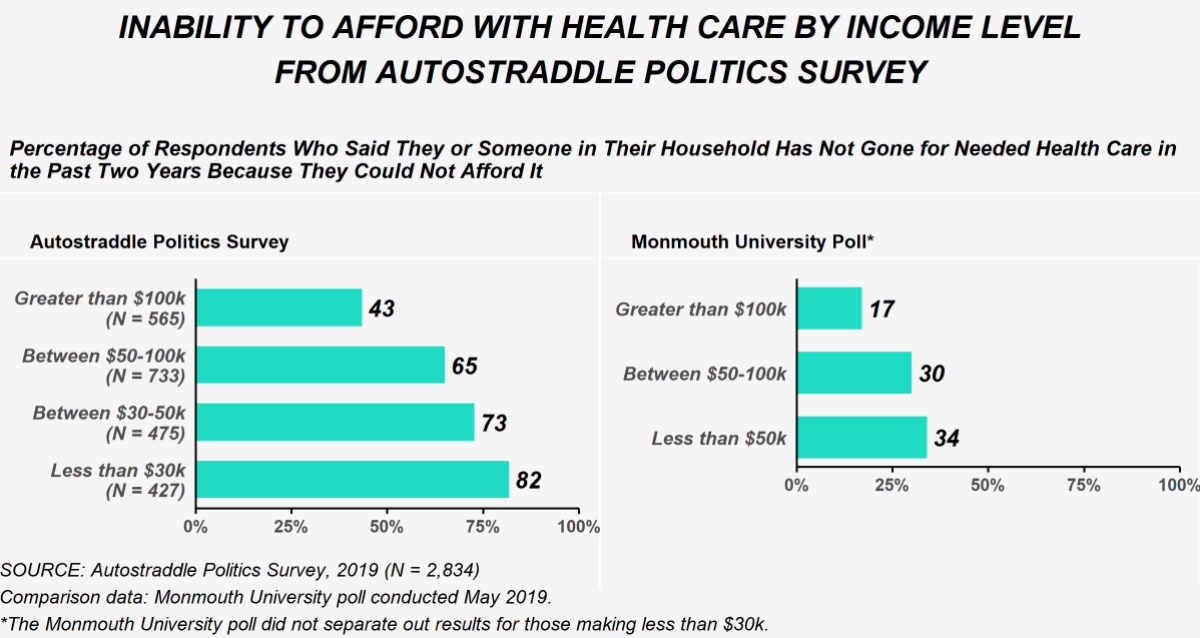
A direct consequence of these disparities in access to care by income level is disparities in access to care by other demographic characteristics that are correlated with income, including gender identity, race/ethnicity and disability status. So while the rate of forgoing health care because of the cost among our community as a whole is 63%, among trans women and non-binary people that rate is 70% and 73% respectively, among Black and Latinx people it’s around 70% and among people living with disabilities it is a galling 78%. Health care is just one more arena where some of the most marginalized members of our community face the dual threats of identity-based discrimination and poverty.
The Growing Appeal of Medicare for All
Several policy ideas have been floated in the last few years to address the high cost of health care. A single public plan like “Medicare for All” has gained substantial traction on the left and dominated much of the conversation during the Democratic primaries. Among Politics Survey respondents, over 80% wanted to move towards a universal public system either immediately or eventually. The American public, of course, is much more divided. The figure below compares responses from the Politics Survey to a Monmouth University poll conducted in August 2019.
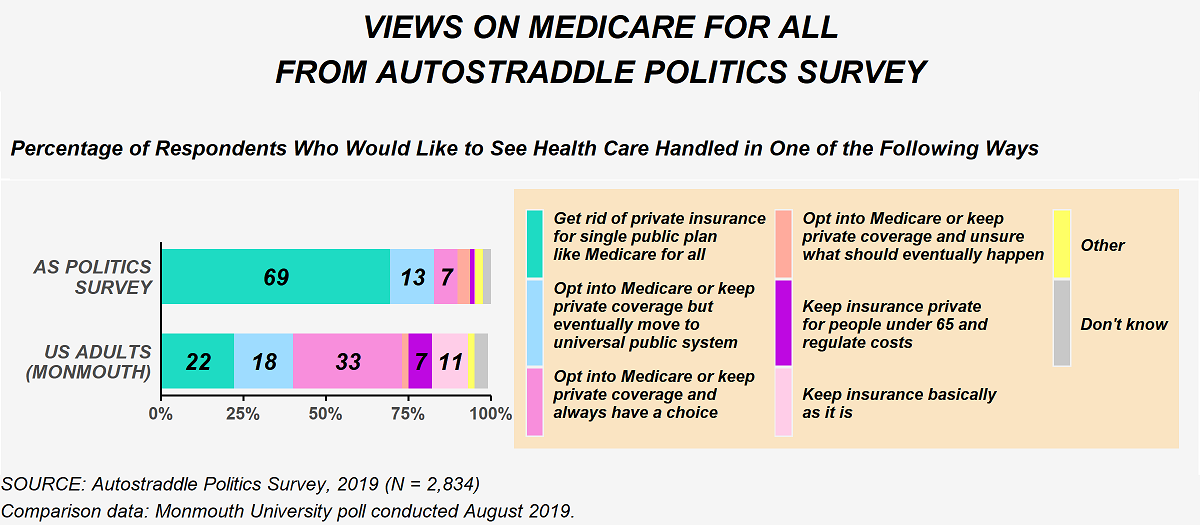
Support for a single payer was substantially higher among Politics Survey Respondents than U.S. adults, regardless of income. But, nonetheless, a greater proportion of our lower income respondents wanted to move towards a universal public system at some point than our higher income respondents: 88% of respondents with an annual income below $30,000 compared to 78% of respondents with an income above $100,000. There wasn’t much variation in support for Medicare for All by gender identity, race/ethnicity or disability.
I was curious to see if the pandemic led to any shifts in how people viewed Medicare for All, so this same question was asked on the Follow Up Survey. Among the people who took the Follow Up Survey, support for moving to Medicare for All at some point stayed about the same. The urgency, however, changed. In the Politics Survey (conducted December 2019 – January 2020), 70% of Follow Up Survey respondents said they wanted to get rid of all private insurance compared with 14% who preferred an opt-in with eventual transition to single payer. By the time of the Follow Up (conducted July – August 2020), that had shifted to 77% and 9%. The change is modest but not statistically significant.
The Supreme Court Could Affect Single Payer Health Care in Many Ways
One of the drawbacks of a single payer public health plan is that, depending on who’s in power, it might not cover politically divisive but medically necessary procedures like hormone therapy, gender reassignment surgery or other trans-inclusive care, contraceptives or abortions. If recent history is any model, it’s fair to assume that even if Democrats managed to pass a plan like Medicare for All that covered all of these things (more on that in a minute), private companies would start suing left and right and the matter would make its way to the Supreme Court. Conservatives on the Court have already proven that they will side with religious freedoms at the expense of contraceptive care, as we saw in Burwell v. Hobby Lobby. All evidence suggests they would act exactly the same way if there were a single payer law with a mandate for covering trans-inclusive care or abortions. And we know Barrett will fall even farther to the right on this than the conservatives currently on the Bench.
In addition to legal scrutiny over what could be covered in such plan, a single payer plan will very likely find itself in court for mandating health coverage, the way the Affordable Care Act has on multiple occasions. Here again, history is instructive of what the future may hold. In 2012, the ACA was narrowly saved with Roberts writing the majority opinion. As a legal scholar explained in a recent interview with The New Yorker, a key issue in that case and the one that will be heard by the Court the week after the election is whether requiring people to purchase health insurance is “an unconstitutional act of coercion.” In the 2012 case, Roberts ruled that the ACA, specifically, was not because of the fines imposed on people who did not purchase health insurance (which Roberts viewed as a “tax” and therefore under the purview of Congress). After Republicans did away with the fines in 2017, the latest challenge to the ACA argues that the current form of the ACA is now coercive.
Many are concerned that Barrett’s hasty nomination to the Court will be the end of the ACA once and for all (a Republican dream and Trump campaign promise). In the hearings, Barrett, of course, punted on the issue, but she has previously criticized Roberts’ 2012 opinion that saved the ACA.
It’s hard not to imagine that all of this would replay itself in one form or another if a public, single payer plan were to somehow become the law. Once again, the Supreme Court has tremendous power in determining the shape of health care in this country.
Biden, of course, does not support single payer, though Harris did during the primary. As the pandemic has worn on, Biden’s moved closer and closer towards it. In July, a “unity task force” between the Biden and Sanders campaigns put forward a plan to expand health care access substantially. While not single payer, the plan will lower the qualifying age for Medicare and includes a government-run public health insurance option. That public option would be available to anyone but would automatically enroll low-income people who lose their jobs. Again, what a conservative court will do with such a law remains to be seen.
Is Everything Doomed?
Barrett will be confirmed before the election. Republicans are bending every rule and norm to make that happen. We will have a 6-3 conservative majority on the Supreme Court in a matter of weeks. Roberts’ seemingly liberal sleight of hand votes that have, bit by bit, undermined policies that enshrine basic rights will no longer put off the inevitable. So where do we go from here?
The only say we have over who’s on the Supreme Court is through who we vote into office in the Senate and the Presidency. For his part, Biden continues to dodge questions about court-packing, which leaves us with something to hope for. Last week, Natalie covered the close Senate races; If you have the money or the time, donate to and volunteer to campaign for those races. And after the election, the phones need to start ringing.

Love these data posts – it’s so interesting to see how the views of the Autostraddle readers are so different from the population as a whole. Looking forward to more data and more graphs.
Thanks so much for reading @sheepgirl! I’m glad you’ve been finding these data posts to be interesting! And it really is striking just how far apart Autostraddle readers and the U.S. population are!
Again super interesting!
Really noticed how you can have an income of over $100.000 and still have trouble with the expensive healthcare. Truely mind-boggling how many people still support that kind of system.
May I ask a probably stupid question?
I noticed the option non-binary woman, and this confuses me, because isn’t non-binary supposed to be neither of the binary options (man and woman)? So what does NB woman mean?
Hey @lesbionic, thanks as always for reading! The percent of people who said they went without care who had incomes over $100,000 surprised me, too. But the income question is about “household” income and the passing up care also included the respondent and anyone in their household. So I can imagine that if, for instance, someone has multiple dependents and the care they need isn’t covered by their health insurance at all they might forego it. A lot of procedures get coded as “cosmetic” in the U.S. even though they aren’t, and so the insurance coverage isn’t as good. For instance, in the survey free text comments, some people noted that Facial Feminization Surgery (to address gender dysphoria) is often considered a “cosmetic” procedure. From personal experience, I know that podiatric care is also often also coded as “cosmetic” even though I and others I know have experienced tremendous pain from having flat feet and bunions. Therapy often ends up in a weird place where it’s not really covered or it’s only covered if you see certain providers, etc. So there’s a lot of things that don’t get covered properly or at all by insurance that could be prohibitive even with a 6-figure salary depending on the circumstances.
As to your question about the gender identities: the survey gave people the following options to choose from:
1. cisgender woman
2. transgender woman
3. non-binary, genderqueer or genderfluid person
4. non-binary, genderqueer or genderfluid woman
5. transgender man
6. non-binary, genderqueer or genderfluid man
7. agender
8. other (with free text)
So the responses from non-binary women shown in the post are people who self-identified that way by selecting option #4 in the gender identity question. I’m not incredibly well-versed in non-binary identities, but I found this Teen Vogue article really helpful. Among the things mentioned in that article: “Being Non-Binary Doesn’t Mean You Can’t Have Any Other Gender Identity: Some people identity as non-binary and as a man or woman or trans or something else. I personally identify as a non-binary woman because, to me, this identity acknowledges both that I don’t have an innate identification with any gender and that I’ve been socialized as a woman. Having more than one gender identity means different things to others, though. 24-year-old Rey Noble identifies as both non-binary and a woman to acknowledge that she loves her female-coded body but doesn’t always feel it accurately represents her.”
I hope that helps!
@himani Thanks a lot!
Yeah, but still, where I am podiatric care is also not insured, but even at the bare minimum of income I could afford to get orthopedic soles. There’s so much price gouging going on it’s unfathomable. The whole system is broken.
And the gender identities make a lot more sense now, thank you so much!
I loathe and fear Amy Coney Barrett, but it is baffling to me that everyone is pointing to the term “sexual preference” (a term which I have seen openly queer people use, including on this very website) as proof of her homophobia. Barrett has said and done very openly, explicitly, unambiguously anti-queer things, like sitting on the board of a school with a policy of not admitting students with gay parents, and signing a letter that defined marriage as “the indissoluble commitment of a man and a woman.” This woman literally hates queer people so much she discriminates against straight cis schoolchildren just for having queer family members! And yet people are acting like the most anti-queer thing she’s ever done is say the word “preference.”
Wow, this article really opened my eyes to a new perspective. Thank you for sharing such valuable insights.
Great stuff thanks for the first time in the information