

As we head into the 2020 election, our contributing data brain, Himani Gupta, is analyzing data from past Autostraddle surveys to find out what issues are most important to our community and what is currently at stake.
Have you ever wondered what America would look like if the reins were handed over to queer people who are women, non-binary and/or trans?
Wonder no more! Using data from Autostraddle’s first-ever political survey, I present to you the gay agenda, as told to me, by you. In this post, we’ll look at the top priority issues in our community, including: LGBTQ+ rights, climate change, income inequality and more!
Who Took the Politics Survey
Before revealing the gay agenda, let’s take a quick look at who took the Politics Survey.
The Politics Survey could be accessed by anyone online through a post on Autostraddle’s website. The survey was open December 3, 2019 through January 10, 2020. Our analysis sample consists of 2,384 queer people who are women, non-binary and/or trans.
In July, I reached out to 994 Politics Survey respondents who said they were comfortable with being contacted about their responses. 662 people completed a Follow Up Survey between July 26 and August 16.
The figure below shows demographic characteristics of Politics Survey and Follow Up Survey respondents, along with comparison data on the U.S. population.
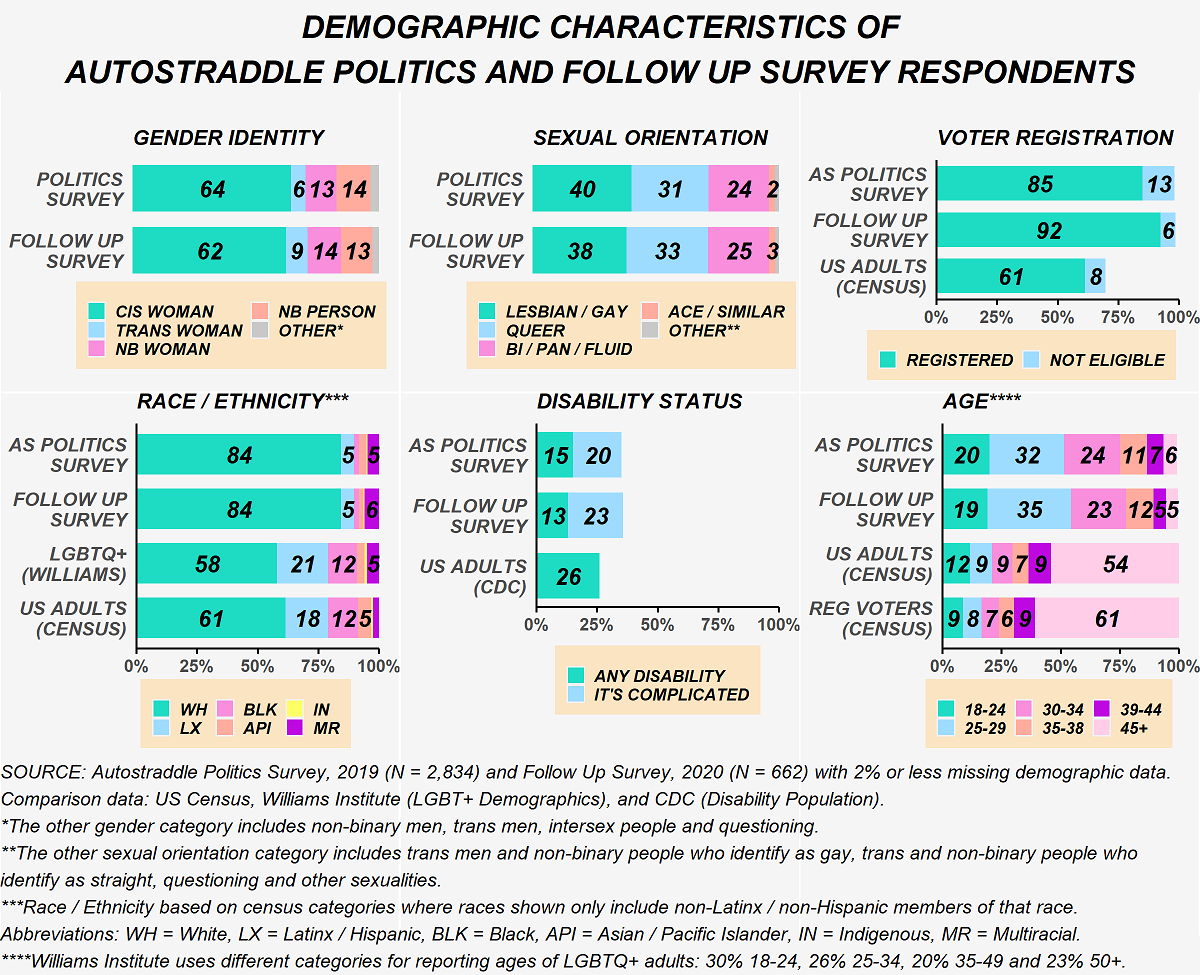
For more information on who took the surveys, see the “Who Took the Survey” portion of the post on health care.
Before the Pandemic, Our Community Had a Fundamentally Different Set of Priorities than the U.S. Population
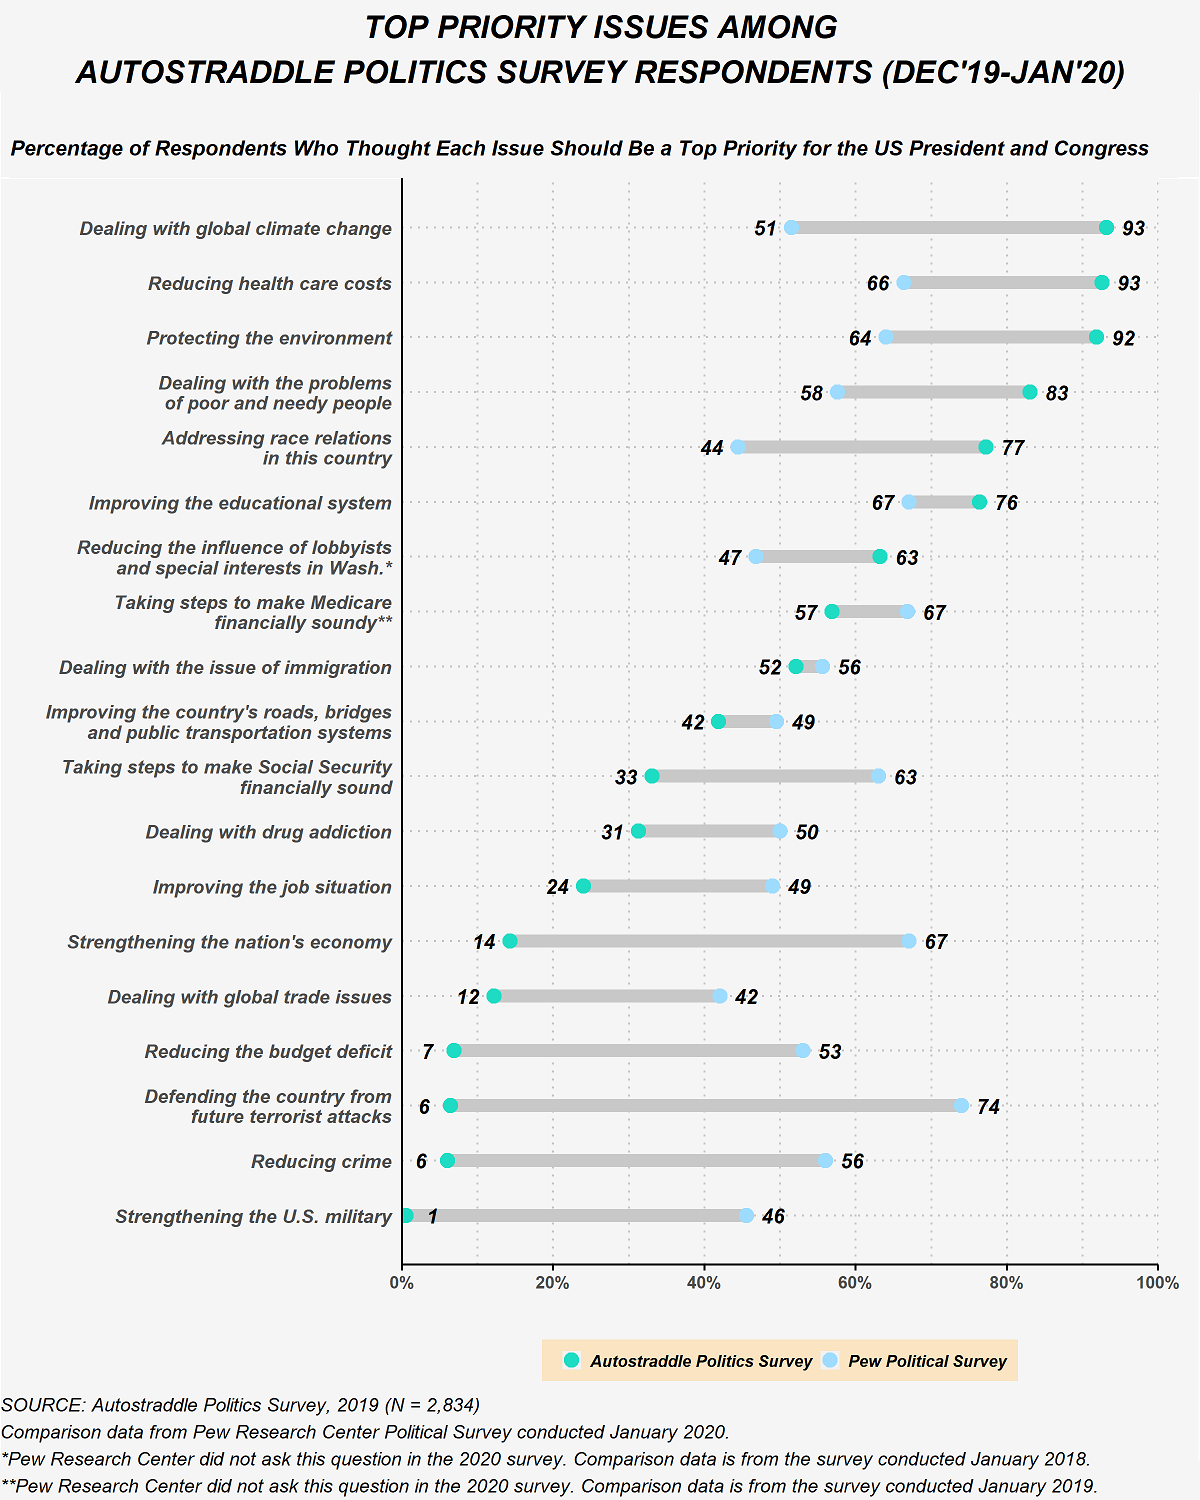
The Politics Survey presented respondents with a series of issues and asked them to indicate whether each one was a “top priority” for the U.S. President and Congress, “important but lower priority,” “not too important,” “not a priority” or “should not be done.” This set of questions was taken from the Pew Research Center’s annual political survey of U.S. adults.
The figure below compares the percentage of Politics Survey respondents who selected each issue as a top priority to the results from Pew’s January 2020 survey. Two things stand out immediately. First, our community has a fundamentally different set of priorities than the U.S. population overall. Second, our community has a broad consensus on what the most important issues are and are not.
One of the several limitations of using survey questions intended for the U.S. population generally is that they overlook some key issues. A glaring omission in the Pew Research Center’s question about top priorities is, of course, LGBTQ+ rights. We also asked respondents to list other top priority issues. Reproductive rights, voter suppression, criminal justice reform, income inequality, gun control and the housing crisis recurred in the responses.
The Autostraddle Politics Survey dove into several of these topics to get a better view of respondents’ perspectives. We’ve previously covered reproductive rights, health care and criminal justice reform in greater detail.
LGBTQ+ Issues: “It’s Hard to Not Pick Them All as Top Priority”
There aren’t a whole lot of surveys focused on LGBTQ+ issues from the perspective of LGBTQ+ people, so for this part of the Politics Survey, we developed our own questions (drawing from a survey by Out.com/YouGov last November and the Pew Research Center in 2013). Once again, we listed several issues and asked respondents to tell us which ones were priorities (using the same categories from earlier). The figure below shows these results.
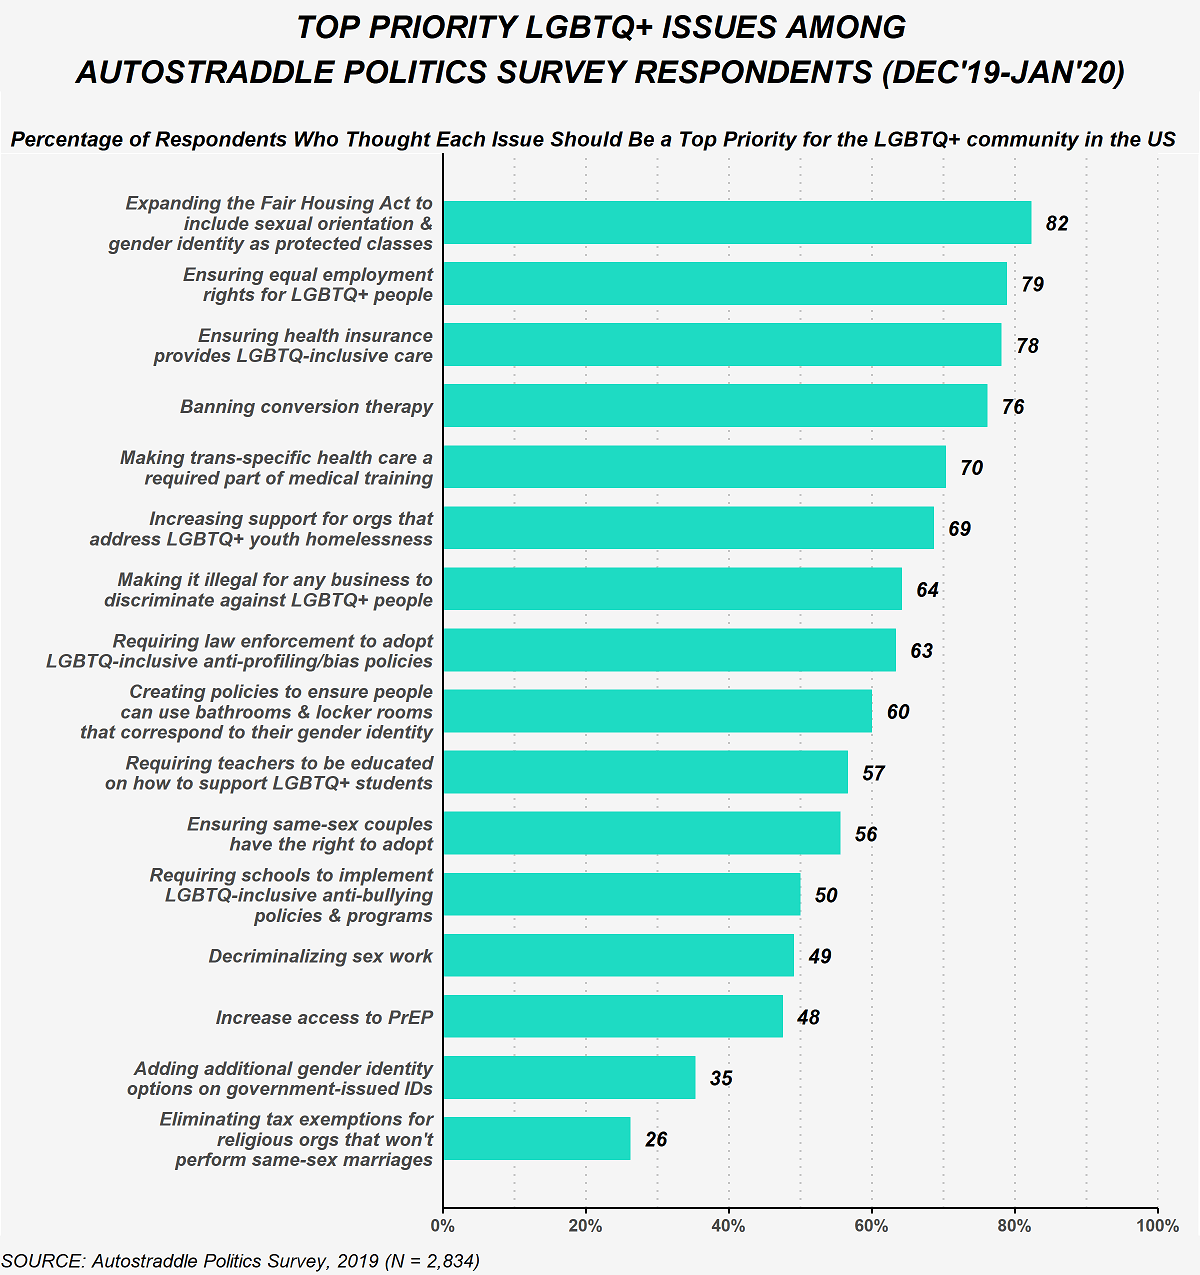
So many of these issues were important to the majority of our respondents. But breaking these results down by demographic characteristics reveals some important differences.
By and large, more trans women and non-binary respondents rated LGBTQ+ issues as “top priorities” as compared to cis women respondents. A higher proportion of trans women and non-binary respondents consistently selected issues that disproportionately affect trans and non-binary people as “top priority” compared with cis women respondents. This includes insurance coverage for LGBTQ-inclusive care, increasing support for organizations dedicated to LGBTQ+ youth homelessness and increasing access to PrEP.
The differences were especially striking for bathroom access (top priority for about 75% of trans women respondents, about 65% of non-binary respondents and about 55% of cis women respondents) and decriminalizing sex work (top priority for nearly 70% of trans women respondents, about 60% of non-binary respondents and about 40% of cis women respondents).
On expanding gender options on government ids, trans women and non-binary respondents differed: about 45% of trans women respondents said it was a top priority compared with a third of non-binary people and cis women respondents. In the comments, several expressed that they’d rather see gender identity removed from ids altogether.
Differences by age were also prominent. Respondents aged 45 or older were generally less likely than younger respondents to select these LGBTQ+ issues as top priorities. Some of the policy-specific differences correspond to what we’ve previously discussed with criminal justice reform, where older respondents were a little more ambivalent about progressive criminal justice reforms. For instance, only a quarter of respondents aged 45 or older said decriminalizing sex work was a top priority issue compared with half of respondents under 45. Also, respondents aged 45 or older were much less likely to select health care related issues (insurance coverage, trans-inclusive medical training and access to PrEP) as top priorities.
There were few, generally modest differences when comparing LGBTQ+ priorities by sexual orientation, race, disability status, income and where respondents live.
Of course, this list of issues is also not comprehensive. In comments respondents indicated other LGBTQ-specific concerns they had. These included expanding refugee and asylum status for LGBTQ+ people, making gender identity and sexual orientation protected classes in civil rights law broadly, reversing the trans military ban and making health care inclusive of intersex people.
Climate Change: “We are Frogs Sitting in an Ever Hotter Pot of Water.”
Over 90% of Politics Survey respondents selected climate change and “protecting the environment” as top priority issues. In a later question, 99% of Politics Survey respondents said the U.S. needs to do more to address climate change compared to 67% of registered voters (from an August 2019 Quinnipiac poll). Politics Survey respondents saw the situation with extreme urgency. Again and again, in the comments, respondents expressed devastation (variations on “We’re all going to die” showed up repeatedly) and the existential need for immediate, meaningful action. For so many respondents, this was the single most important issue, far above any of the others.
In terms of what to do, 94% of Politics Survey respondents said a Green New Deal that “[invests] government money in green jobs and energy efficient infrastructure” was a “good idea.” This level of support is the same as the 93% of U.S. adults who identify as progressives, but much higher than 63% of adults overall (from a July 2019 NPR/PBS NewsHour/Marist Poll). In the comments, several respondents said the Green New Deal is just a starting point and that much, much more needs to be done. As one person observed (and others similarly reflected), “The real answer is ending capitalism.”
The Economy: “It’s a Lie.”
In stark contrast with the U.S. population overall, Politics Survey respondents largely deprioritized traditional economic concerns, with a third or less of respondents selecting any of the following as a top priority issue: “improving the job situation,” “strengthening the nation’s economy,” “dealing with global trade”, “reducing the budget deficit” and making Social Security “financially sound.”
Respondents living with disabilities and those aged 45 or older were 10 and 20 percentage points (respectively) more likely to say that making Social Security “financially sound” was a top priority, probably because more of these respondents utilize or know someone who utilizes Social Security. However, in both cases the communities were divided on this issue with less than 50% of respondents living with disabilities and respondents aged 45 or older choosing that as a top priority issue.
Around 80% of all Politics Survey respondents felt that “dealing with the problems of poor and needy people” was the top priority economic issue. As mentioned earlier, many respondents listed income inequality as another top priority issue; several others mentioned equal pay, student loan debt and labor rights.
90% of Politics Survey respondents wanted to see a $15 national minimum wage, compared to 56% of U.S. adults overall and 86% of progressives (from a July 2019 NPR/PBS NewsHour/Marist Poll). Many respondents commented that the minimum wage should be even higher. Several noted that it should be tied to cost of living to account for current variations across the country and to control for future price increases. Others would rather see universal basic income instead.
Relatedly, 94% of Politics Survey respondents felt that the federal government needed to do more to ensure equal pay between men and women in the private sector, while registered voters in the U.S. were much more ambivalent (from a September 2019 Politico/Morning Consult poll). In the comments, several respondents also raised the need to address income disparities by race.
On student loans, 93% of Politics Survey respondents supported forgiving up to $50,000 for people with household incomes below $250,000, compared to 57% of registered voters (from an April 2019 Quinnipiac poll). Even accounting for our younger, more credentialed (and therefore more debt-laden) sample, Politics Survey respondents were still far more in favor of loan forgiveness and many commented that all loans should be forgiven.
Race Relations: “He Just Lifted the Mask.”
“Addressing race relations” was a top priority issue for a much larger proportion of Politics Survey respondents than U.S. adults. In a follow up question, 98% of Politics Survey respondents said they thought “white supremacist groups pose a threat in the U.S.” compared to 65% of registered voters (from a March 2019 Quinnipiac poll).
90% of Politics Survey respondents felt that the “level of hatred and prejudice in the U.S. has increased” under Trump and 8% said it hadn’t changed, compared to 64% of U.S. adults saying “increased” and 28% saying “hasn’t changed.” In comments, several Politics Survey respondents elaborated that the visibility and violence of hate and prejudice have increased under Trump, though the underlying beliefs haven’t necessarily changed.
In terms of prejudice against different racial groups, sweeping majorities of Politics Survey respondents viewed prejudice against Black people, Latinx people and Indigenous people as “very serious problems:” 93% when asked about Black people, 88% when asked about Latinx people and 84% when asked about Indigenous people. In contrast, just under 45% of registered voters said prejudice against Black and Latinx people was a “very serious problem” (from an August 2019 Quinnipiac, which did not ask about Indigenous people). And on the other end, more U.S. adults selected “reducing crime” as a top priority rather than “addressing race relations,” even though we all know that policies around so-called crime reduction only serve to exacerbate racial issues in this country. In contrast, just 6 percent of our Politics Survey respondents viewed “reducing crime” as a top priority issue. Instead, in the comments respondents raised substantial overhaul of the criminal justice system (police and prison abolition) as a top priority.
Immigration: “Climate Change Doesn’t Recognize National Borders”
52% of Politics Survey respondents selected “dealing with the issue of immigration” as a top priority, but many commented that they didn’t know how to answer that question since the way in which the issue was dealt with would dramatically change their answer (ie, “open borders” versus “build the wall”).
96% of Politics Survey respondents supported a pathway to citizenship which is the same as the 95% of progressives who support it though far higher than the 64% of U.S. adults nationally (from a July 2019 NPR/PBS NewsHour/Marist Poll). However, 83% of Politics Survey respondents supported decriminalizing crossing the U.S. border without authorization compared to only 54% of progressives and 27% of U.S. adults overall. 89% of Politics Survey respondents also wanted to see asylum laws “loosened to accept more claims” compared to just 25% of U.S. adults (from a September 2019 Harvard/Harris poll).
Politics Survey respondents commented on the hypocrisy of harsh immigration restrictions given that the U.S. was founded on stolen land. Many mentioned the extraordinary cruelty at the hands of the Trump administration: the detention of children and family separations. Several wanted to see ICE abolished. Others observed that the legal pathways to immigration and citizenship were incredibly complicated and impossible to navigate.
Another theme that emerged in the comments was the lack of responsibility on the part of America. Many people trying to enter the U.S. are fleeing conflicts of American making in Latin America and the Middle East. Asylum, which already had an absurdly low cap during the Obama years, has been practically non-existent under Trump. Instead, Politics Survey respondents wanted to see fully open borders, especially since climate change (also largely of America’s making) is creating yet one more refugee crisis.
U.S. Military: “They Need to be So Majorly Defunded”
Politics Survey respondents largely thought that “defending the country from future terrorist attacks” was not a top priority; over 50% of respondents indicated that this was “not too important” or “not a priority.” When it came to “strengthening the U.S. military” over 50% of respondents flat out rejected that proposition and said it “should not be done.”
Many respondents commented that military spending should be reduced and reallocated to public services in the U.S. or the State Department. Generally, those who left comments opposed war and wanted the U.S. to end its long, imperialist entanglements in Latin America and the Middle East. Several observed that Trump made an already-bad situation decidedly worse with his ignorance, erratic behavior and pandering to dictators.
At the same time, some commenters acknowledged that extricating the military isn’t straightforward, either. For instance, many referenced Trump’s abandoning the Kurds in Syria, as an instance where, while they generally opposed U.S. military involvement, they also opposed suddenly withdrawing troops without diplomatic solutions in place.
Gun Control: “I Carry a Bleed Kit Because Shootings are So Common.”
Gun policy wasn’t on the list of issues on the Pew Research Center’s 2018 political survey, which I used as the basis for the Politics Survey. (It was on Pew’s 2020 political survey and 46% of U.S. adults viewed it as a top priority issue.) The Politics Survey did include a few questions on gun policy, however.
97% of Politics Survey respondents supported the House bill closing the private seller loophole on background checks. Background checks have broad support in the U.S. with 83% of registered voters in favor (from a September 2019 Quinnipiac poll). Among our Politics Survey respondents, there was also strong support for an assault weapon ban and mandatory buyback with 89% supporting. U.S. adults are divided on this issue, with only 43% supporting (from an August 2019 Monmouth poll).
There was a notable difference within our community on gun policy by gender identity. Cis women, non-binary people and non-binary women respondents were in favor of the gun control policies mentioned at roughly the rates noted above. The majority of trans women respondents also supported the policies mentioned but not by the same margins. On mandatory buybacks, specifically, 72% of trans women respondents supported the policy while 15% opposed and 14% were uncertain. In the comments, a few trans women respondents explained that a foreseeable consequence of the mandatory buyback is greater police presence in low income, predominantly Black communities, a position also held by progressive Democratic presidential primary candidate, Julián Castro.
Many, many respondents (across all genders) wanted all guns banned. Over 80% were worried about a mass shooting in their communities. So many described being traumatized by gun violence and mass shootings that had already happened in their communities and living under the constant threat of gun violence. Several respondents wanted to see bans for domestic abusers and law enforcement disarmed, as well. But another theme that emerged among a minority of respondents was that — in the absence of disarming the police, military and white supremacists — oppressed, marginalized communities should arm themselves in self-defense.
And Then There Was a Pandemic
So much has happened since the Politics Survey was fielded, so we followed up with some of the original Politics Survey respondents to see how their views have shifted. Instead of repeating the questions on top priority issues from Pew, we used a series of questions asking whether different issues in the U.S. are “a very big problem,” “a moderately big problem,” “a small problem” or “not a problem at all.” (You might think Trump himself wrote the answer options for this question, but it was, in fact, taken from Pew’s American Trend Panel.)
The results are shown below. As we saw in the Politics Survey, Follow Up Survey respondents have drastically different concerns than U.S. adults generally, and they also broadly agree on what problems are the biggest and not the biggest.

The pandemic and the treatment of racial minorities (people of color) in the criminal justice system were considered “very big problems” by nearly everyone who took the Follow Up survey. Climate change and health care affordability were viewed by Follow Up Survey respondents as “very big problems” at the same rates as these issues were top priorities on the Politics Survey. On the other end, terrorism, violent crime and the budget deficit were considered “very big problems” by roughly as few respondents as who thought these issues were “top priorities” on the Politics Survey. Several respondents commented that they thought domestic terrorism and state-sanctioned violence were very big problems but knew that this is probably not how the question was intended.
Once immigration was clarified by the use of the word “illegal,” Follow Up Survey respondents unequivocally rejected it with two-thirds declaring it to be “not a problem at all.” Unemployment came to the forefront for over half of Follow Up Survey respondents, more than doubling the quarter of respondents who viewed the related issue of “improving the job situation” as a “top priority” on the original Politics Survey. While the questions are asking slightly different things, this drastic increase is likely in response to the rampant unemployment in the wake of the pandemic.
When asked to identify other big problems, many of the same topics came up as in the Politics Survey free responses. Right-wing extremism and fascism were new additions that occurred with some frequency.
LGBTQ+ Priority Issues Shift towards Trans Rights and Supporting Youth
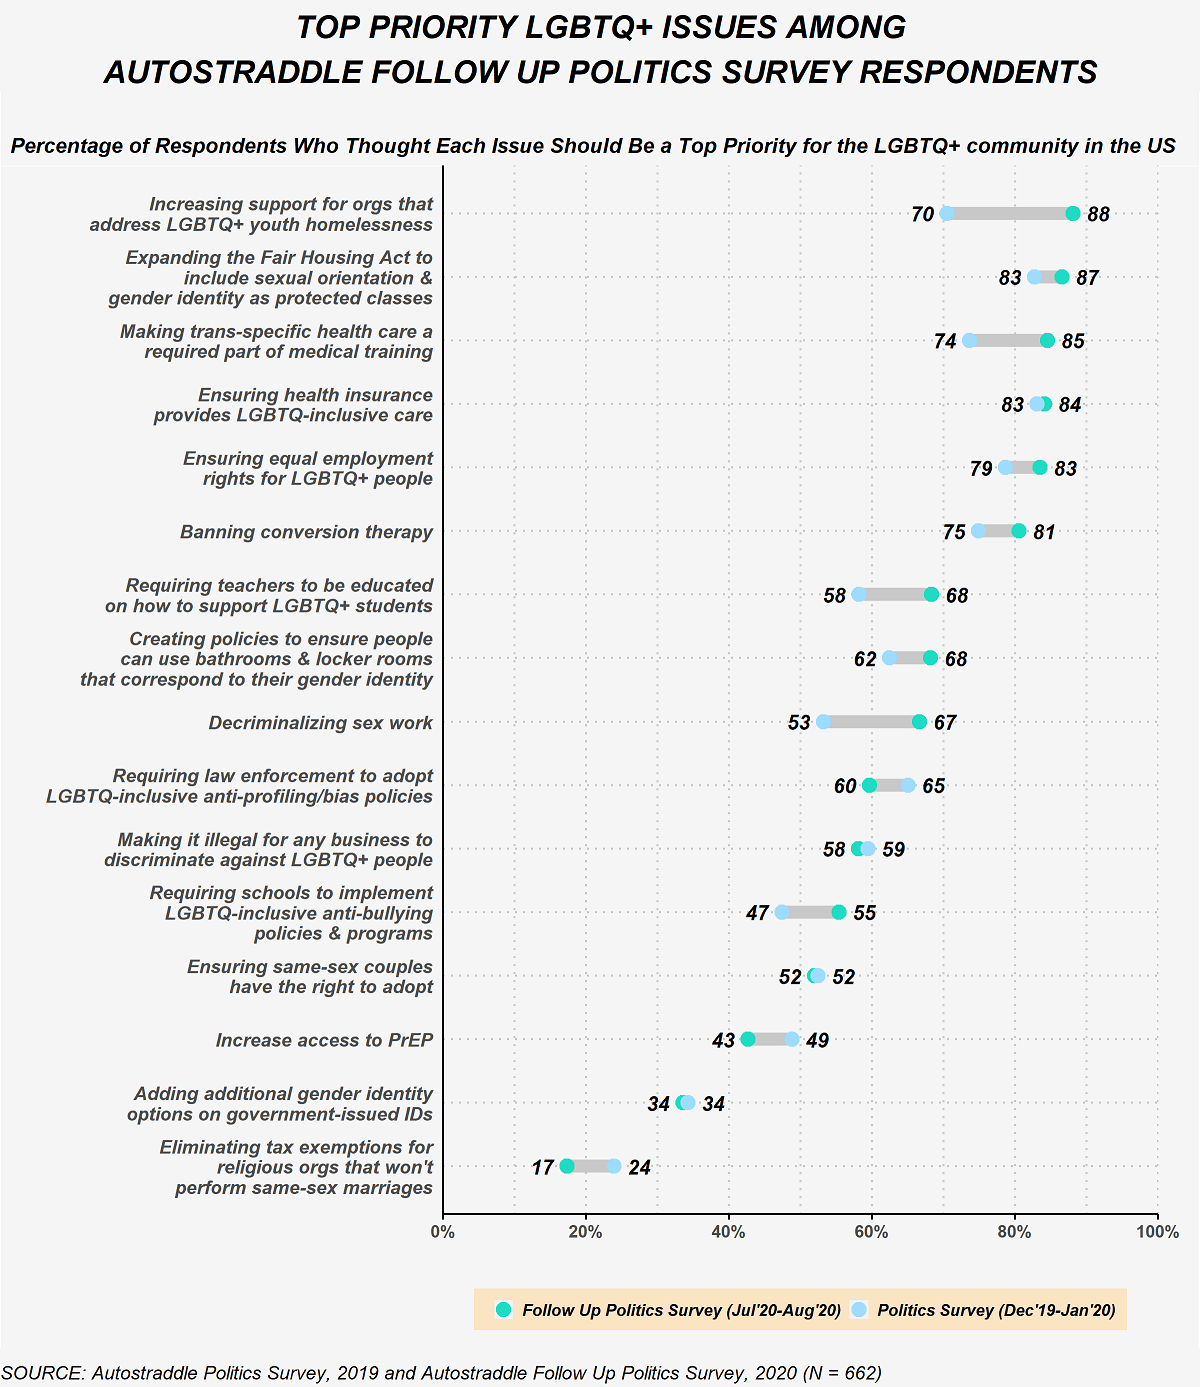
In the Follow Up survey we asked respondents to identify their top priorities among the same LGBTQ+ issues from the Politics Survey. These results are shown in the figure below. There were meaningful shifts towards prioritizing issues affecting trans people and LGBTQ+ youth and decriminalizing sex work. Interestingly, despite the Supreme Court ruling on LGBTQ+ employment protections in Bostock earlier this summer, ensuring equal employment rights remained a top priority issue for over 80% of Follow Up survey respondents.
So there we have it. If queer people who are women, non-binary and/or trans were running the country it would be, undeniably, a more environmentally friendly, equitable and humane place to live. And while the U.S. is a long way from achieving the things so many of us care about, this election — like every one that came before it and every one that comes after — brings us one step closer towards realizing the policies we want. The work doesn’t stop with voting (by any means), but it’s a critical part of our political action toolkit. And after the election, we need to keep applying pressure on our newly-elected officials to make our priorities their priorities.


Comments
Himani, I so appreciate all the work you put into these articles, from tracking down multiple comparison polls for the general population to thinking about how to visually present the data to make it as clear as possible. Excellent work!
Thank you so much! I really appreciate that!
Cool data, but also wow AS readers are so white. I can’t say I’m surprised though.
This is true. There’s also been a lot of changes in the site, from the top down that I’m hoping will help to continue expanding our reader base.
And from a data stand point, for everything I’ve reported from the Politics survey, I compared results by race/ethnicity. If there were differences by race, those are mentioned in the post (by and large, there are very few differences by race). So while it’s true that most of the people who took the survey are white, I think there’s also some truth to the fact that the views shared represent more than just the views of white queer people. (I know you weren’t saying otherwise, but the racial make up of our readers and the survey sample, specifically, is a question I’ve been thinking about for like 10 months now so I just wanted to share some of my thoughts on that…)
Thank you for this very detailed series! It’s so interesting :) I’m seriously impressed by the AS crowd!
Also the comparison to society-wide opinions is very interesting. Seems like the American public at large is dumb as bread!
We should take over the world – it would be for the best of everyone and everything :p
“We should take over the world – it would be for the best of everyone and everything” — that is also my take away from all this :)
Thank you for this Himani! I do wish that we could get more interest from American citizens on actual visa reform. 77% of the nearly 45M immigrants are “legal”. The majority of “unauthorized” immigrants are those who have entered the country legally but have been stumped by a black-box visa system. Transforming non-permanent resident visas to incorporate broader skill sets, a clearcut approach toward obtaining these visas, and a straight-forward pathway to permanent residency & citizenship for those on NPR visas would benefit everybody. And yet it’s not a conversation being had in debates or politics round tables. Let’s stop hand wringing about good intentioned but vaguely worded visa policies and talk about points based systems! They work!
Thanks for reading!
You know, this is such a good point you’re raising and one that I myself haven’t given a ton of policy thought to, in terms of how to fix the visa issues in this country. Because, you’re right that that is fundamentally the issue, that most people who are now undocumented are visa overstays. And the other part of that problem, I would argue, is how limited asylum is (even before Trump, but especially during Trump).
When it comes to the process to get visas approved, it’s just… I honestly have no words for it. The stories I’ve heard from friends are just truly horrific. And I really do fear, in the event of a second Trump term, what they will do to the so-called “legal” avenues of immigration. It’s already been practically ground to a halt. Will they start revoking visas, greencards and revisiting naturalized citizens next? (The latter, I know, is already happening…)
I don’t know much about points-based systems (other than what I learned after 5 minutes of reading wiki) so I have a lot more research to do on that before I can say one way or another. For my part, I do just think borders (across the board) should be open. But then, I’ve never been one for nationalism.