

As we head into the 2020 election, our contributing data brain, Himani Gupta, is analyzing data from past Autostraddle surveys to find out what issues are most important to our community and what is currently at stake.
America’s criminal justice system was racist from its inception, but the issue only garners mainstream attention after high profile, tragic murders of Black people at the hands of law enforcement. This summer was one of those moments, with a resurgence of support for the Black Lives Matter movement in the wake of George Floyd’s brutal murder.
Back in December 2019, Autostraddle conducted its first ever politics survey. As I began working the data, the world started changing at an accelerating rate. But many of the key questions at the core of that survey remained: where does this community stand on pressing criminal justice issues including bail, incarceration and police brutality?
We’ll explore those questions using data from the Politics Survey and more recent data from Autostraddle’s 2020 Reader Survey.
Who Took the Surveys?
To make sense of our survey results, we first need to take a look at who took the two surveys!
Both surveys were available online through posts on Autostraddle’s website. The Politics Survey was open from December 3, 2019 through January 10, 2020. Over 4,400 people started the survey and about two-thirds made it to the mandatory questions on gender identity and sexual orientation. The Reader Survey was open July 7 through July 15. Nearly 3,400 people started the survey and over 90% made it to those same mandatory identity questions.
The analysis samples are restricted to LGBTQ+ people who identify as women, non-binary and/or trans living in the U.S. (The criminal justice questions on the Reader Survey were only asked of people who live in the U.S. so both samples were restricted to U.S. residents.) This gives us our final samples of 2,409 people on the Politics Survey and 1,950 people on the Reader Survey.
These are what the stats-y among us call “convenience samples” because anyone online could opt to take the surveys, so there’s self-selection bias. This limits how much we can use these results to make general statements about the political views of LGBTQ+ people who identify as women, non-binary, and/or trans.
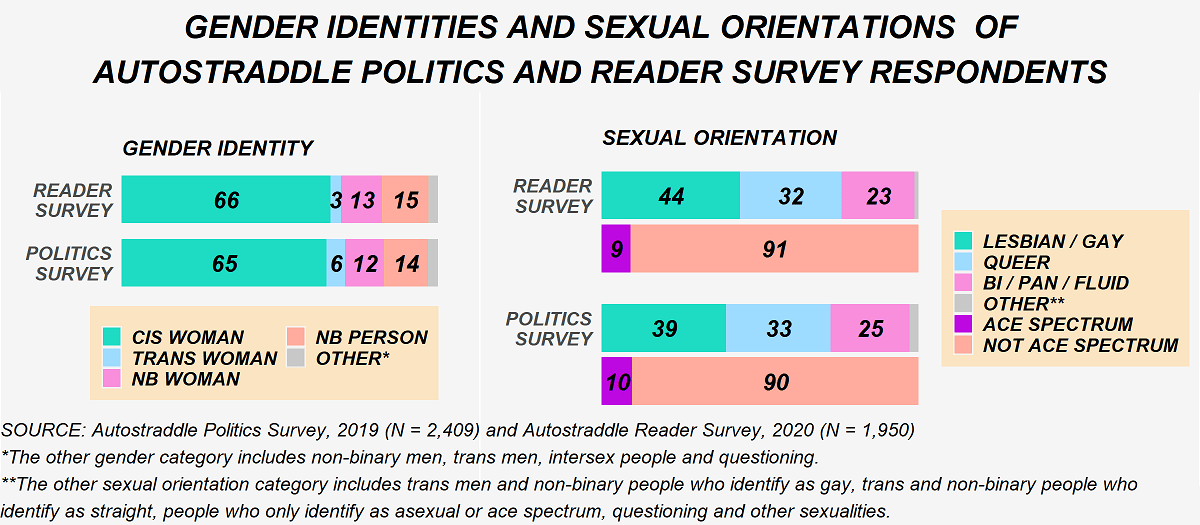
The figure below shows the gender identities and sexual orientations of our two samples. We got comparable mixes of respondents of different gender identities both times, though fewer trans women responded to the Reader Survey than the Politics Survey. Respondents are also fairly similar based on their sexual orientations1, although the reader survey had more respondents who identified as lesbian/gay as a whole.
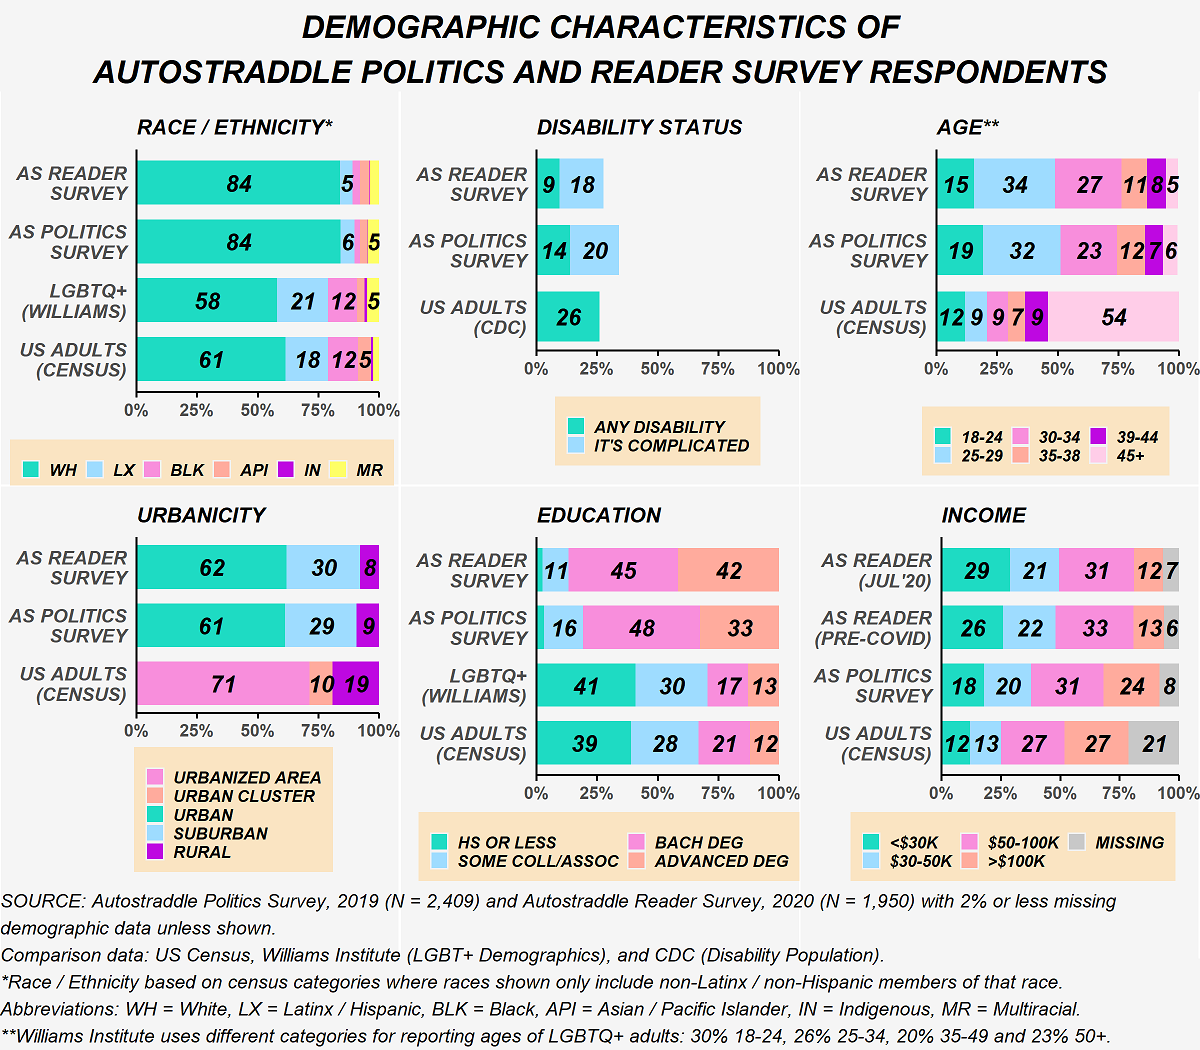
The two samples are similar on some demographic characteristics but share some noticeable differences. The figure below compares the demographic characteristics of our two samples and also provides data on the U.S. adult population (from the Census and CDC) and LGBTQ+ adults in the U.S. (from the Williams Institute) for reference. Respondents to the Politics and Reader Surveys were similar in their racial/ethnic makeup and in the types of places they live in. (Note that the Census uses “urbanized clusters” and “urbanized areas” for reporting, which are substantially different than how most people define urban and suburban.) The Reader Survey had fewer respondents with disabilities than the Politics Survey. Reader Survey respondents were also slightly older and generally had higher levels of educational attainment. The biggest difference is in terms of household income: respondents to the Reader Survey had substantially lower household incomes than respondents to the Politics Survey, even before the pandemic hit.
In addition to these measured differences, the two samples are, by definition, going to be different because of self-selection. It’s very likely that a different type of person might be motivated to take a survey dedicated to political issues in the U.S. (and a fairly long survey, at that) than the type of person who will take a more general reader survey.
Despite all these caveats, there’s still a lot we can learn from these data about our community’s perspectives on criminal justice reform and how that has shifted in the wake of this summer’s BLM protests.
Much of Our Community Was Already Supporting Progressive Stances on Criminal Justice Issues
The Politics Survey asked questions that touched on several aspects of the criminal justice system. The questions were taken from a study by the Center for American Progress (CAP) Action Fund conducted in July 2019 and polls conducted by the Associated Press and NORC at the University of Chicago (AP-NORC) in September 2019 and NPR/PBS News Hour/Marist (NPR/PBS/Marist) in July 2019.
View of the System as a Whole
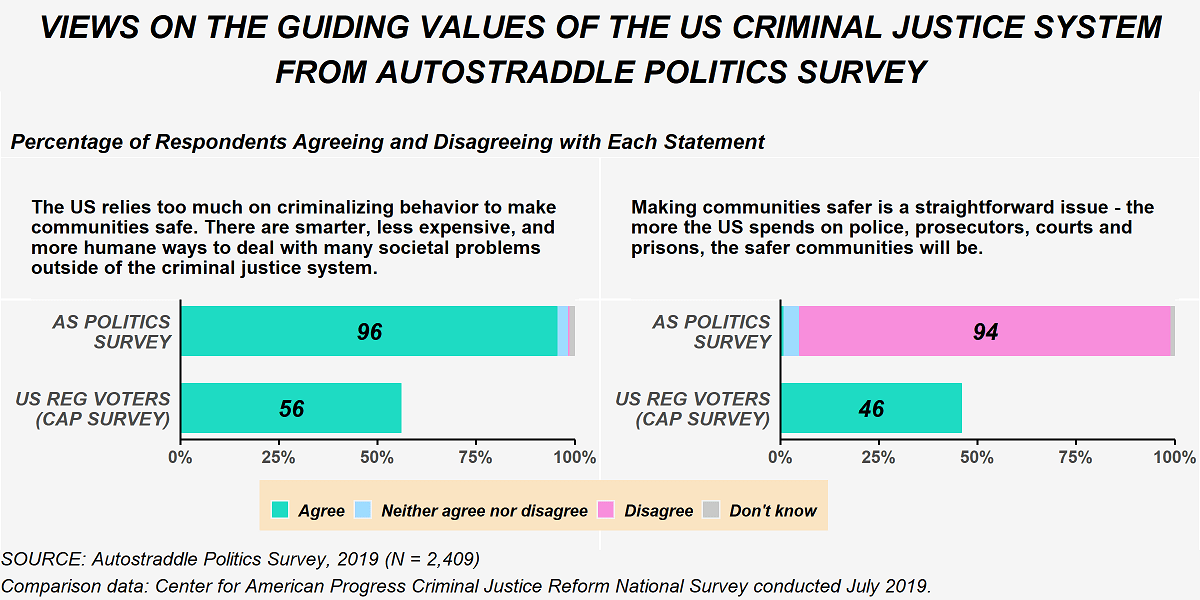
Two questions taken from the CAP study asked respondents whether they agreed or disagreed with the overarching value propositions that guide the U.S.’s criminal justice system currently: criminalizing behavior and investing in law enforcement. The figure below compares responses from the Politics Survey to the data released about registered U.S. voters. Politics Survey respondents were nearly unanimous in rejecting the positions that guide the U.S.’s criminal justice system, agreeing that “the U.S. relies too much on criminalizing behavior” and disagreeing that spending more money on police, prosecutors and prisons will make communities safer. This stands in contrast to registered voters nationally who were more divided on these two questions.
Substantial Support for Legalizing Marijuana
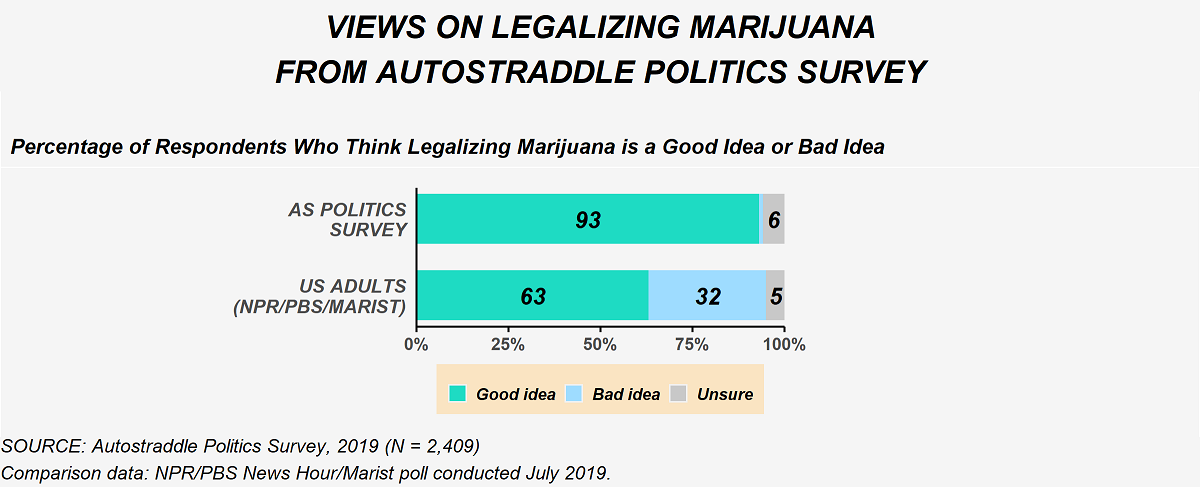
There’s been a national surge in support for legalizing marijuana in the last several years, with states steadily moving towards passing this policy. The figure below shows how Politics Survey respondents viewed the issue, compared with U.S. adults. Politics Survey respondents largely supported legalizing marijuana. A generally popular issue, at the time of the NPR/PBS/Marist poll, just under two-thirds of U.S. adults also supported the policy; this has largely held constant since last year.
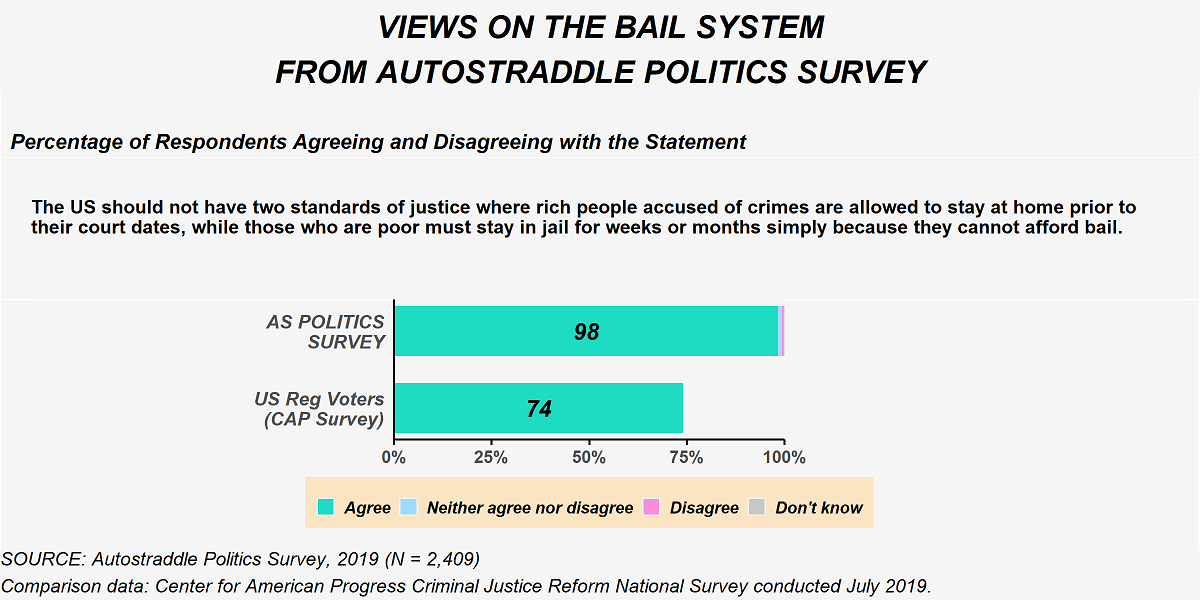
Near Consensus that Bail Creates a Double Standard
Nearly all Politics Survey respondents felt the bail system created “two standards of justice;” this position also had significant support nationally. Bail reform was a big topic at the time, as New York state (most notably) was considering a massive change to its bail system that would eliminate bail for most arrests. (That reform passed and went into effect on January 1 of this year, but in April the state legislature and governor walked it back, a pattern we’ve seen play out a few times, now.) The figure below shows responses from the Politics Survey compared with U.S. voters.
Multiple Perspectives on Incarceration
Politics Survey respondents overwhelmingly rejected the current guiding principles of the criminal justice system and the bail system and think marijuana should be legalized. On incarceration, though, our respondents are more conflicted. The figure below shows their responses to two questions on incarceration. There’s still strong support for reducing incarceration rates and that level of support is higher than the U.S. overall, but there’s a greater mix in Politics Survey respondents’ views on the issue compared to the ones discussed earlier.
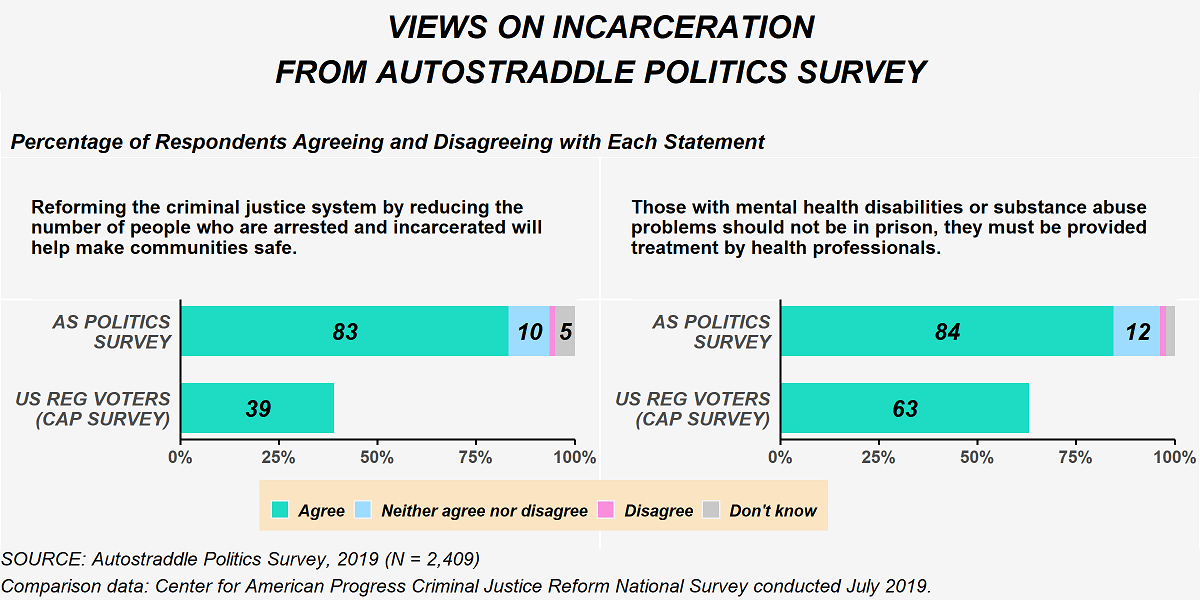
Several respondents shared their thoughts in free-text comments on the question specific to those with mental health disabilities or substance abuse problems. A few common themes emerged among those who did not agree with the statement. First, respondents’ position depended on the crime with many saying that violent crimes such as murder and rape warranted incarceration. Second, several felt it was important to clarify that no one should be incarcerated for their mental health or substance abuse problems. Third, many expressed that proper treatment should be provided in the situations where incarceration is warranted.
The view that some crimes do justify arrest and incarceration also appeared in the free-text responses of people who agreed with the statement that people with mental health disabilities or substance abuse problems shouldn’t be incarcerated. Many who agreed with the statement called for increased investment in communities, social services and rehabilitation to addressed the underlying problems currently leading to arrest and incarceration. Several people decried private prisons while others went further and called for full abolition.
Near Consensus that Police Violence is a Problem
Back in December, a large majority (over 80%) of Autostraddle Politics Survey respondents already believed that police violence against the public was an extremely or very serious problem, compared to just over a third of U.S. adults as a whole. This is shown in the figure below.
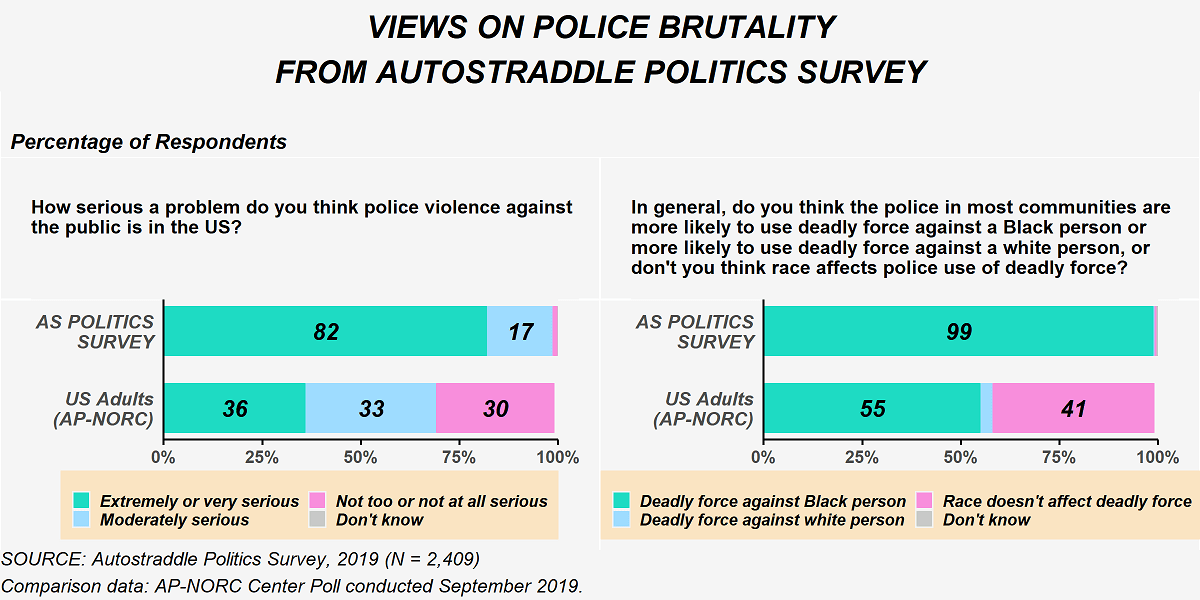
This isn’t entirely surprising because 29% of Autostraddle Politics Survey respondents said they were worried about being the victim of police brutality and another 8% were unsure (not shown). In contrast, when Quinnipiac University asked registered voters this question in April 2018, only 21% shared those worries while 79% definitively said they were not worried. But, awareness of the issue of police violence among Autostraddle Politics Survey respondents also went beyond personal experiences: there was a near consensus that police are more likely to use deadly force against a Black person. And while that statement is a fact and not an opinion, just over half of U.S. adults actually believed it last September (this June that was up to 61%).
What’s Shifted in Our Community on Criminal Justice Reform
Given the substantial support progressive criminal justice reform issues already had back in December, there were only small pockets of our community that might have shifted their views on these particular questions in light of everything that happened this summer. The Reader Survey asked fewer questions about criminal justice reform. Two were repeated from the Politics Survey. The CAP Survey doesn’t have new results available, but the AP-NORC poll was conducted again more recently in June. A third question was added from a Yahoo News/YouGov poll conducted at the end of May.
Support for Reducing Arrest and Incarceration was the Same on the Reader Survey
Interestingly, there was no change in the proportion of Autostraddle Respondents who agreed that reducing arrest and incarceration rates would make communities safe. We did not ask the question about people with mental health disabilities or substance abuse issues a second time, and there is no new data on U.S. registered voters from the CAP survey. Neither survey asked about prison abolition so we also don’t know how much traction that position has within our community. On the Reader Survey, many people explained their thoughts on this question in free text comments, and the same themes from the Politics Survey emerged.
Police Brutality was Viewed as a More Serious Issue among Reader Survey Respondents
Police brutality was under a spotlight this summer after the murder of George Floyd was followed by video after video of police officers’ violent treatment of Black people and unwarranted responses to protesters. We wanted to see if this changed how our community views police violence. Results from the Reader Survey are shown in the figure below. The proportion who view police violence against the public as an extremely or very serious problem did increase by eleven percentage points between the Politics Survey and the Reader Survey, which is comparable to the shift we see among U.S. Adults nationally. But, as mentioned before, the Politics and Reader Survey samples are clearly different, so it’s hard to know if that shift is indicative of changes in our community’s views on police violence against the public or because different people were asked this question. The truth is probably a little bit of both.
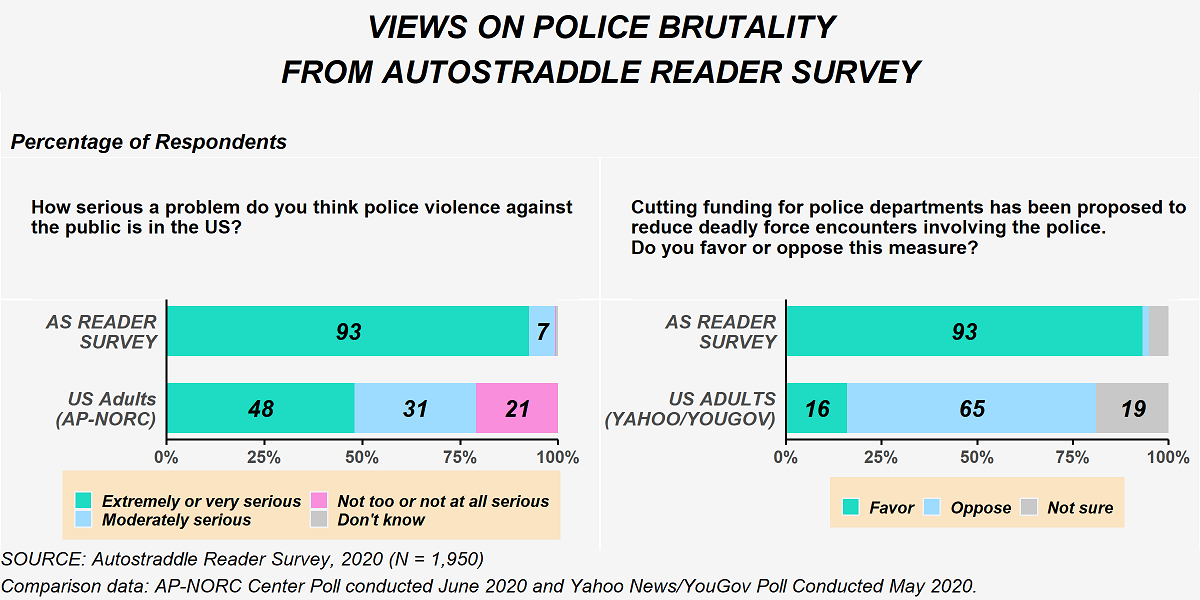
Finally, the Reader Survey asked about defunding police and an overwhelming majority of respondents favored defunding. In free-text comments, many people went further and wanted to see full abolition. While in stark contrast to the U.S. nationally, this position doesn’t come entirely as a surprise based on the other perspectives on criminal justice issues shared in the Autostraddle Reader Survey, and the overwhelming support for progressive criminal justice positions observed on the Autostraddle Politics Survey.
Summing Up: How Our Community Compares to the U.S. Nationally
Clearly, there are substantial differences between where our community stands on these issues compared to the U.S. overall. That was strikingly true in December 2019/January 2020 and it remained true in July 2020. But as we saw earlier, our community is strikingly different from the U.S. population. Our group is quite a bit younger, quite a bit more educated, quite a bit less affluent, quite a bit whiter, quite a bit less likely to live in a rural area and quite a bit more likely to vote Democrat. While it’s true that younger, less affluent people who live in urban areas and vote for Democratic candidates are more likely to look at the criminal justice system from a progressive reform or abolition lens, even when accounting for those characteristics, our respondents were still in favor of substantive criminal justice reform at much higher rates than their counterparts nationally. (Also, on the flip side, white people, nationally, generally view progress criminal justice reform propositions less favorably than Black or Latinx people.)
With Such Overwhelming Consensus on These Issues, Any Differences within Our Community are Largely Undetectable
At this point, some of you may wonder whether there were any meaningful differences within our community. Are trans women and non-binary people, for instance, more likely to be in near- unanimous consensus on these issues compared to cis women? What about people who identify as lesbian or gay versus those who identify as bisexual, pansexual or sexually fluid versus those who identify as queer; or people who identify as asexual or on the ace spectrum compared to those who don’t? Race and ability have to factor into all of this as well, right? Certainly, these are questions I had.
I looked at all of this, and more, and the tl;dr is there was no indication of differences based on the identity characteristics of our respondents.2 There was some evidence to suggest some differences by age, with people aged 45 or older being more likely to take a middling position (for example, “neither agree nor disagree” or the issue is a “moderately serious” problem) than younger respondents. However, while the differences were substantively meaningful – for instance 66% of Reader Survey respondents aged 45 or older agreed on the question on reducing incarceration and arrest rates to keep communities safe, compared to 88% of Reader Survey respondents under the age of 29, and the same was true on the Politics Survey – the differences were not statistically significant due to the relatively small number of people on our surveys in the 45 and older age group. So there’s some suggestive evidence that something might be going on by age, which aligns with what we know to be true nationally as well.
What all of this tells us is that while there are differing perspectives in our community on the criminal justice system, the drivers of those differences don’t seem to be identity factors, by and large.
Beliefs in Action
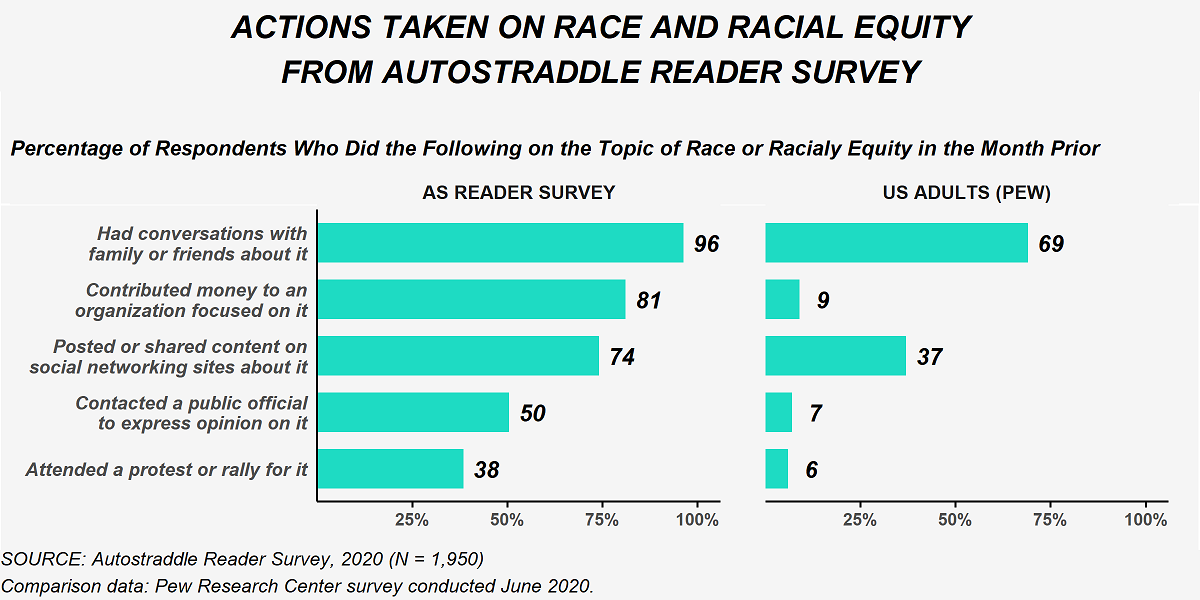
The Reader Survey asked if respondents supported the Black Lives Matter movement and a near unanimous 98% said they did. This support did manifest in concrete actions related to race and racial equity. Some of the actions taken by Reader Survey respondents are shown in the figure below, with national comparisons from a survey conducted by the Pew Research Center in June 2020.
In a follow up question, nearly 85% of Reader Survey respondents who hadn’t attended a protest or rally said they didn’t because of concerns about spreading or contracting COVID-19; 15% indicated that accessibility was an issue as well (respondents could select more than one answer for this question).
Our community wants to see real, meaningful change when it comes to the criminal justice system. The upcoming U.S. elections are an opportunity towards building that. So much of what happens with the criminal justice system is in the hands of local and state governments. We’ve seen this play out time and again this year, from the bail reform effort in New York to Minneapolis City Council’s attempt to dismantle the police department to Austin’s reduction of the police budget. Many of the policies discussed here are decided by lower level, elected public officials and others are directly on the ballot. Check out this guide from “What’s on the ballot?” for information on district attorney races and state supreme court seats as well as ballot measures on drug policy, policing and more.
Voting — at all levels — is an important first step towards turning these beliefs into policy. Honestly, no one has said this better than these strippers from Atlanta:
1Sexual orientation was asked differently on the two surveys. On the Politics Survey, respondents were asked to select the sexual orientation they most strongly identified with from the following list: lesbian, queer, bisexual, pansexual, sexually fluid, asexual (or similar), gay, straight or other; they were then asked to select any other sexual or romantic orientations they identified with (same options as before plus: homoromantic, panromantic, biromantic, aromantic and heteroromantic). On the Reader Survey, respondents were first asked if they identified as asexual or on the asexual spectrum. Then, all respondents were asked to pick the term that best described their sexual / romantic orientation from the following list: lesbian, queer, bisexual, pansexual, sexually fluid, gay, straight, not sure or other. To align these, the Politics Survey data was recoded as follows: anyone who identified as asexual or aromantic on either of the two questions (or indicated an asexual adjacent orientation such as demisexual or graysexual in the free text) is considered part of the “Ace spectrum” group. For those who indicated they are asexual on the first question, their responses to the second question were analyzed to see if they could be recoded as any of the other sexual orientations. If they selected more than one or if they only indicated asexual/aromantic then they were included in the “other” category.
2 For the stats people: The results were not statistically significant by and large. There were nine different measures. Looking at the overall results, there’s no way there would be variation by demographic on the questions about bail, criminalizing behavior to make communities safe, spending more money on the criminal justice system to make communities safe or police use of deadly force against Black versus white people. This leaves us with five measures where there could be differences. However, because so few people selected “disagree” or “oppose,” most of the tests failed to calculate properly due to low sample. Basically, there just isn’t enough variation in the data to indicate statistically significant differences. On income, one measure was significant, but I didn’t count that since the others were either not significant or were inconclusive (in an attempt to acknowledge multiple hypothesis testing issues). Sexual orientation did turn up significant differences when I excluded the “other” orientations category, but they were qualitatively meaningless and more likely artifacts of the large sample size than true differences (the largest difference was 8 percentage points). The one exception to this (age) is discussed in the text.

So interesting – thank you for such a thorough report (and also for such detailed stats more generally, which made my nerd brain very happy). And while I definitely want to avoid self-congratulatory complacency both personally and community-wide, I’m really struck by that last graph and hope it indicates a real, ongoing commitment to concrete actions toward racial justice. I found many of the articles published in June and July to be really helpful in terms of providing actionable steps, and love seeing these priorities reflected in the editorial vision.
I’m aware this is a kind of incoherent stream-of-consciousness comment…but yeah thanks again, this is great stuff and I’m looking forward to more survey discussion and stats :)
Thanks so much for reading @awkwardfemme! I agree with you about wanting to not be complacent but it really is incredible how involved this community is.
Very interesting analysis!
Thanks so much for reading! I’m glad you found it interesting!
Himani, thank you for the data and the in-depth and careful analysis. I’m not from the US and love the context this article provides.
Thanks so much for reading! I’m glad you found the analysis interesting and the context helpful!
Very Interesting information. I searches for grinder on google I see your blog I read it , Its interesting information. First I see a website related to kitchen grinder https://grinderquery.com/
It’s really good news to the CVS Pharmacy Customers. Because, CVS Pharmacy conducting a survey with the name CVSHealthSurvey at the official survey page https://www.cvshealthsurvey.blog/. Through this link, you can take part in the CVS Survey and get a chance to win a $1000.